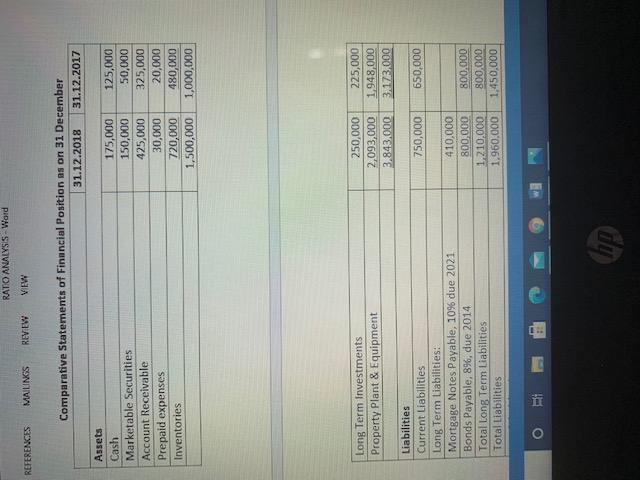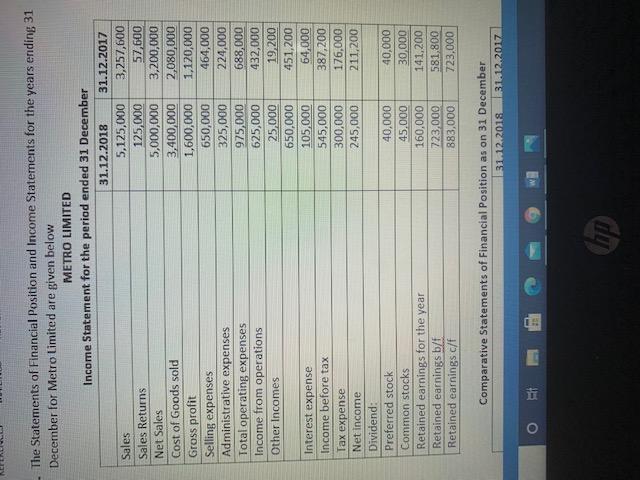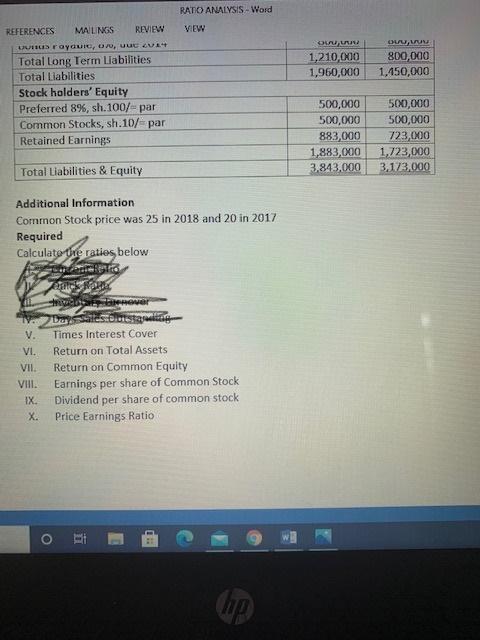


RATO ANALYSIS - Word VIEW REFERENCES MAILINGS REV EW Comparative Statements of Financial Position as on 31 December 31.12.2018 31.12.2017 Assets Cash 175,000 125,000 Marketable Securities 150,000 50,000 Account Receivable 425,000 325,000 Prepaid expenses 30,000 20,000 Inventories 720,000 480,000 1,500,000 1,000,000 Long Term Investments Property Plant & Equipment 250,000 2,093,000 3.843.000 225,000 1948,000 3.173.000 750,000 650,000 Liabilities Current Liabilities Long Term Liabilities: Mortgage Notes Payable, 10% due 2021 Bonds Payable, 8%, due 2014 Total Long Term Liabilities Total Liabilities 410,000 800,000 1.210,000 1.960.000 800.000 800.000 1,450,000 o . hp The Statements of Financial Position and Income Statements for the years ending 31 December for Metro Limited are given below METRO LIMITED Income Statement for the period ended 31 December 31.12.2018 31.12.2017 Sales 5,125,000 3,257,600 Sales Returns 125,000 57,600 Net Sales 5,000,000 3,200,000 Cost of Goods sold 3,400,000 2,080,000 Gross profit 1,600,000 1,120,000 Selling expenses 650,000 464,000 Administrative expenses 325,000 224,000 Total operating expenses 975,000 688,000 Income from operations 625,000 432,000 Other Incomes 25,000 19,200 650,000 451,200 Interest expense 105,000 64,000 Income before tax 545,000 387,200 Tax expense 300,000 176,000 Net income 245,000 211,200 Dividend: Preferred stock 40,000 40,000 Common stocks 45,000 30,000 Retained earnings for the year 160,000 141,200 Retained earnings b/f 723,000 581,800 Retained earnings c/ 883,000 723,000 Comparative Statements of Financial Position as on 31 December 31.12.2018 31.12.2017 V. Times Interest Cover VI. Return on Total Assets VII. Return on Common Equity VIII. Earnings per share of Common Stock IX. Dividend per share of common stock X. Price Earnings Ratio RATO ANALYSIS - Word VIEW OLU 1,210,000 1,960,000 Owu, 800,000 1,450,000 REFERENCES MALNOS REVIEW UV radu, 10. JUU Total Long Term Liabilities Total Liabilities Stock holders' Equity Preferred 8%, sh.100/- par Common Stocks, sh.10/ par Retained Earnings 500,000 500,000 883,000 1,883,000 3.843,000 500,000 500,000 723,000 1,723,000 3,173,000 Total Liabilities & Equity Additional Information Common Stock price was 25 in 2018 and 20 in 2017 Required Calculato the raties below V. VI. VII. VIII. IX. X. Web Dress Times Interest Cover Return on Total Assets Return on Common Equity Earnings per share of Common Stock Dividend per share of common stock Price Earnings Ratio O LE 1. he


