

Answered step by step
Verified Expert Solution
Question
1 Approved Answer
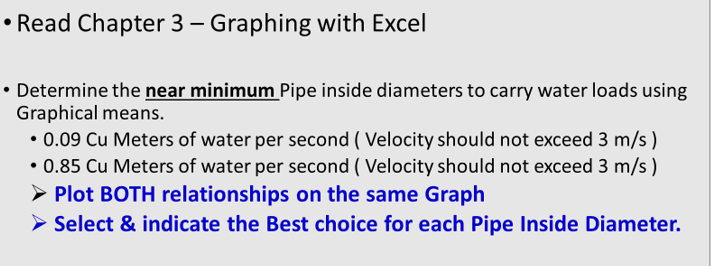
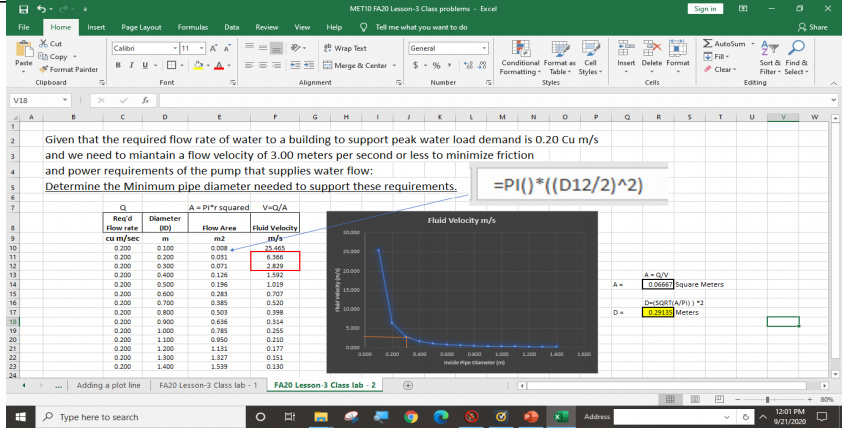
Read Chapter 3 - Graphing with Excel Determine the near minimum Pipe inside diameters to carry water loads using Graphical means. 0.09 Cu Meters of
Step by Step Solution
There are 3 Steps involved in it
Step: 1

Get Instant Access to Expert-Tailored Solutions
See step-by-step solutions with expert insights and AI powered tools for academic success
Step: 2

Step: 3
Ace Your Homework with AI
Get the answers you need in no time with our AI-driven, step-by-step assistance
Get Started
Beginning VB 2008 Databases
Authors: Vidya Vrat Agarwal, James Huddleston
1st Edition
1590599470, 978-1590599471