Question
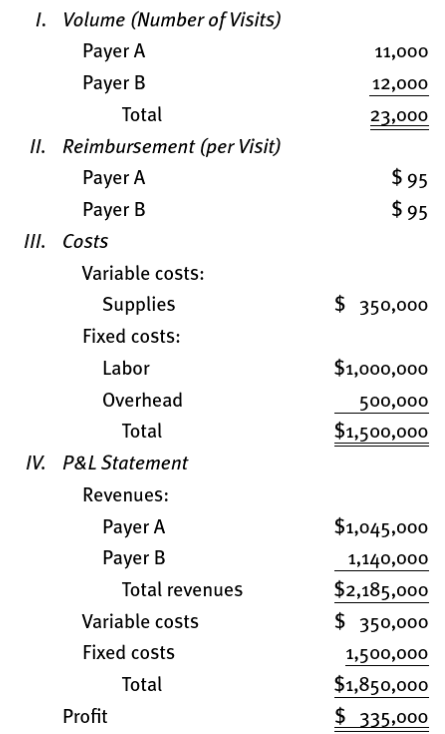
Read Chapters 6 in Reiter & Song (2018). Complete the following End-of-Chapter Problems using Microsoft Excel or Word 6.1 Consider the following 2016 data for
Read Chapters 6 in Reiter & Song (2018).
- Complete the following End-of-Chapter Problems using Microsoft Excel or Word
- 6.1 Consider the following 2016 data for Newark General Hospital (in millions of dollar):

a. Calculate and interpret the two profit variances.
b. Calculate and interpret the two revenue variances.
c. Calculate and interpret the two cost variances.
d. How are the variances related?
- 6.2 Following are the budgets of Brandon Surgery Center for the most recent historical quarter (in thousands of dollars):
-

- The center assumes that all revenues and costs are variable and hence tied directly to patient volume.
- a. Explain how each amount in the flexible budget was calculated. (Hint: Examine the simple budget to determine the relationship of each budget line to volume.)
- b. Determine the variances for each line of the P&L statement, both in dollar terms and in percentage terms.
- c. What do the results in part b tell Brandons managers about the centers operations for the quarter?
- 6.3 Refer to Carroll Clinics 2016 operating budget, contained in exhibit 6.2. Instead of the actual results reported in exhibit 6.3, assume the following results:

a. What are the profit, revenue, and cost variances based on the simple (exhibit 6.2) budget?
b. Construct Carrolls flexible budget for 2016.
c. What are the profit, revenue, and cost variances based on the flexible budget?
d. Interpret your results. In particular, focus on the differences between the variance analysis here and the Carroll Clinic illustration presented in the chapter.
\begin{tabular}{lrrr} & Simple & Flexible & Actual \\ \hline Number of surgeries & 1,200 & 1,300 & 1,300 \\ Patient revenue & $2,400 & $2,600 & $2,535 \\ Salary expense & $1,200 & $1,300 & $1,365 \\ Nonsalary expense & $600 & $650 & $585 \\ Profit & $600 & $650 & $585 \end{tabular} \begin{tabular}{lccc} & SimpleBudget & FlexibleBudget & ActualResults \\ \hline Revenues & $4.7 & $4.8 & $4.5 \\ Costs & 4.1 & 4.1 & 4.2 \\ Profit & 0.6 & 0.7 & 0.3 \end{tabular} I. Volume (Number of Visits) PayerAPayerBTotal11,00012,00023,000 II. Reimbursement (per Visit) PayerAPayerB$95$95 III. Costs Variable costs: Supplies $350,000 Fixed costs: \begin{tabular}{lr} Labor & $1,000,000 \\ Overhead & 500,000 \\ Total & $1,500,000 \\ \hline \end{tabular} IV. P\&L Statement Revenues: Payer A Payer B Total revenues Variable costs Fixed costs Total Profit $1,045,000 1,140,000 $2,185,000 \$350,000 1,500,000 $1,850,000 $335,000 \begin{tabular}{lrrr} & Simple & Flexible & Actual \\ \hline Number of surgeries & 1,200 & 1,300 & 1,300 \\ Patient revenue & $2,400 & $2,600 & $2,535 \\ Salary expense & $1,200 & $1,300 & $1,365 \\ Nonsalary expense & $600 & $650 & $585 \\ Profit & $600 & $650 & $585 \end{tabular} \begin{tabular}{lccc} & SimpleBudget & FlexibleBudget & ActualResults \\ \hline Revenues & $4.7 & $4.8 & $4.5 \\ Costs & 4.1 & 4.1 & 4.2 \\ Profit & 0.6 & 0.7 & 0.3 \end{tabular} I. Volume (Number of Visits) PayerAPayerBTotal11,00012,00023,000 II. Reimbursement (per Visit) PayerAPayerB$95$95 III. Costs Variable costs: Supplies $350,000 Fixed costs: \begin{tabular}{lr} Labor & $1,000,000 \\ Overhead & 500,000 \\ Total & $1,500,000 \\ \hline \end{tabular} IV. P\&L Statement Revenues: Payer A Payer B Total revenues Variable costs Fixed costs Total Profit $1,045,000 1,140,000 $2,185,000 \$350,000 1,500,000 $1,850,000 $335,000Step by Step Solution
There are 3 Steps involved in it
Step: 1

Get Instant Access to Expert-Tailored Solutions
See step-by-step solutions with expert insights and AI powered tools for academic success
Step: 2

Step: 3

Ace Your Homework with AI
Get the answers you need in no time with our AI-driven, step-by-step assistance
Get Started


