

Question
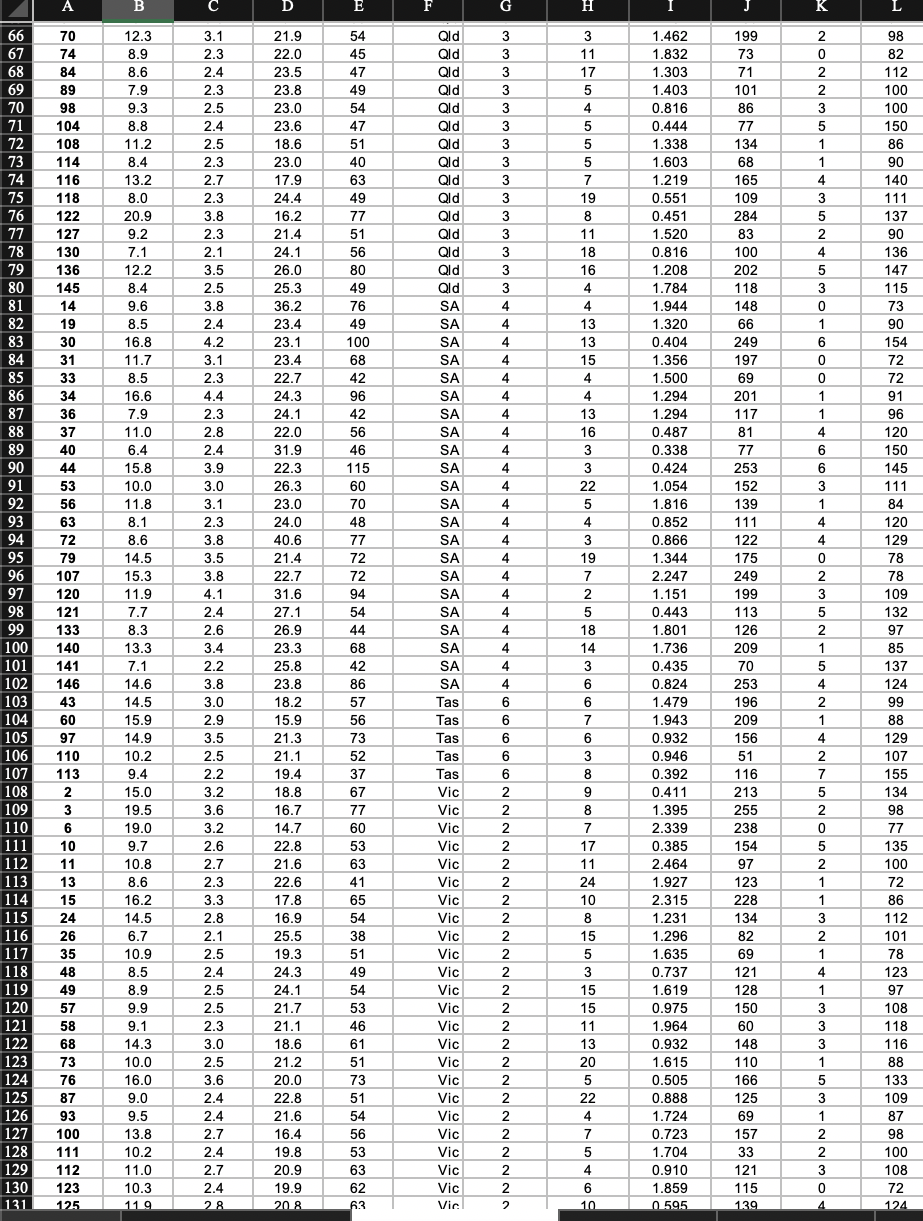
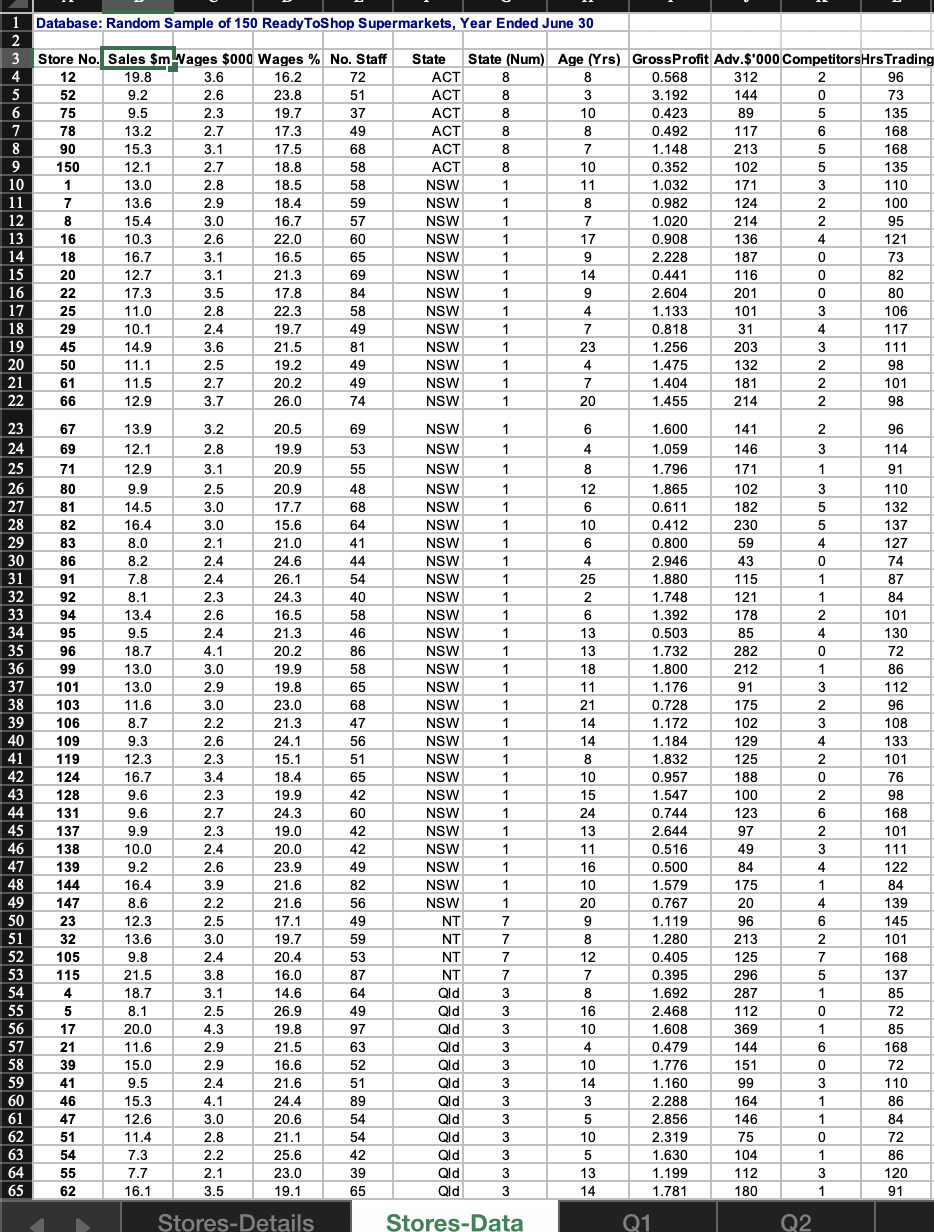
ReadyToShop LimitedReadyToShop Limited: Background ReadyToShop Ltd is one of Australia's leading supermarket chains. Originating from a family-based chain of general stores, ReadyToShop now has supermarkets
ReadyToShop LimitedReadyToShop Limited: Background
ReadyToShop Ltd is one of Australia's leading supermarket chains. Originating from a family-based chain of general stores, ReadyToShop now has supermarkets all over Australia. Each state capital has a company office. The company planning and direction take place in the company Head Office in Melbourne. A principal role of the Research and Development department in the Melbourne office is to provide statistical advice on matters affecting the company. You (Adam Brown) are one of the leading analysts in the department.
You have received an email from the Director of Analytics (Kayden Li), that contains specific questions that you must answer.
Email from the Director of Analytics
To: Adam Brown
From: Director of Analytics, Kayden Li
Subject: Analysis of the provided data set
Dear Adam,
At the resent board meeting, the directors have decided to initiate certain business analysis on a survey conducted three months ago. As one of the leading analysts, can you do the following analysis and provide a report?
- Revenue is the most important measure that the ReadyToShop is interested in. Provide with an overall estimate of the average revenue for all the stores in all the locations?
Hint: You will need to produce the relevant tabulated summary statistics and graph(s). Then, you will need to calculate a 90% confidence interval for average Revenue
2.Are there any differences in the overall proportion of stores surveyed in ACT, NSW, NT, QLD? That is, is there any one state sampled proportionally, that is represented more than the others?
Hint: You will need to calculate the proportion of the number of stores surveyed in ACT, NSW, NT, QLD produce the relevant tabulated summary statistics and graph(s). Then, you will need to calculate, compare and contrast, 90% confidence interval estimates for the proportion of stores in ACT, NSW, NT, QLD. Make sure that you interpret your findings.
3. Are there any relationships between the variables wages, number of staff, advertising, competitors and trading hours with the sales of the business (Consider Sales as the dependent variable)?
Hint: You will need to calculate suitable association measures and create relevant graph(s). Then interpret the highlights of key measures.
4. Assuming that the Sales is approximately normally distributed, answer the following questions for the following states separately:
a. What is the probability that Sales exceeds $17million?
b. What is the probability that Sales would be less than $8million?
c. What is the minimum value of Sales that only the top 10% of the stores will achieve annually?
Hint: You only consider the sales distribution for this question. To answer this question, you will need to produce descriptive summary statistics and find relevant information to apply for the probability calculations.
Please note that this diagram is only related topart cof this question
5. 5.a. It has been suggested at our most recent meeting that the average sales of the 4 states NSW, QLD and VIC
are now more than $14million. Does this data confirm this hypothesis?
5.b. Further, is there sufficient evidence to conclude that the proportion of sales in any state is below 35% of all sales?
Hint: To answer this question, you will need to conduct appropriate hypothesis testing for each state separately (using 5% significance level).
Finally, include an interactive Dashboard to explore the performance of Wages, Number of staff and Gross profit.
3.
Step by Step Solution
There are 3 Steps involved in it
Step: 1

Get Instant Access to Expert-Tailored Solutions
See step-by-step solutions with expert insights and AI powered tools for academic success
Step: 2

Step: 3
Ace Your Homework with AI
Get the answers you need in no time with our AI-driven, step-by-step assistance
Get Started
Discrete and Combinatorial Mathematics An Applied Introduction
Authors: Ralph P. Grimaldi
5th edition
201726343, 978-0201726343