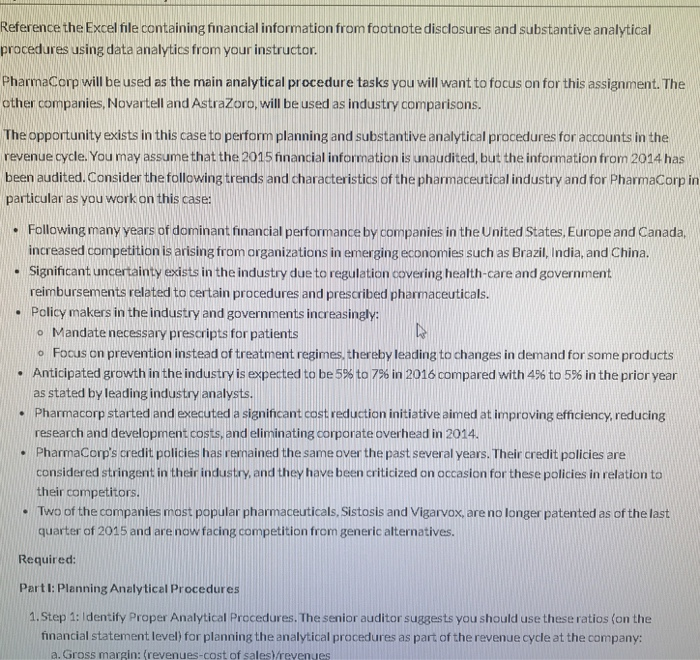
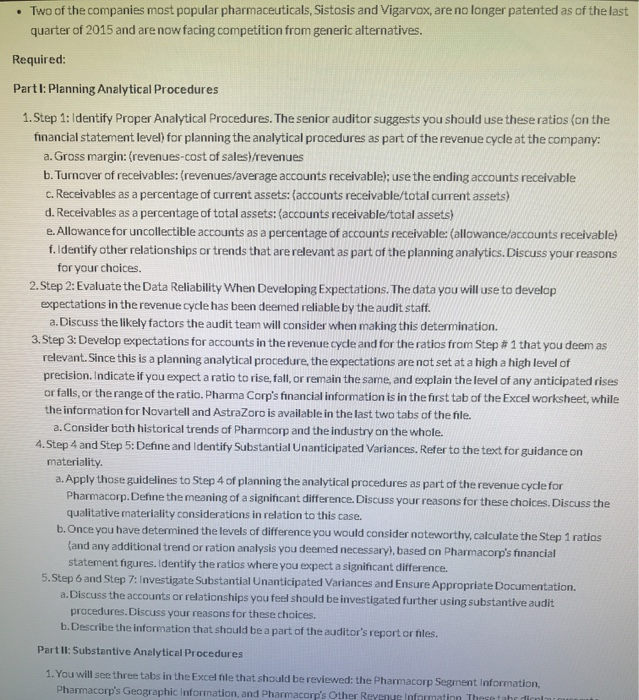
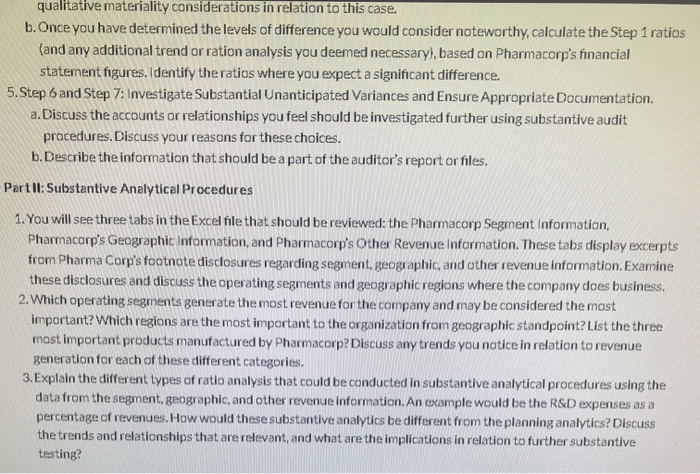
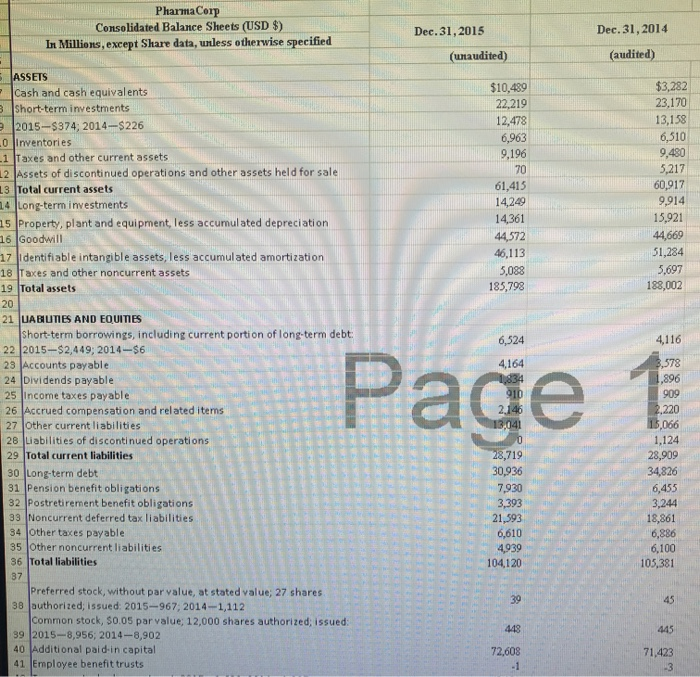
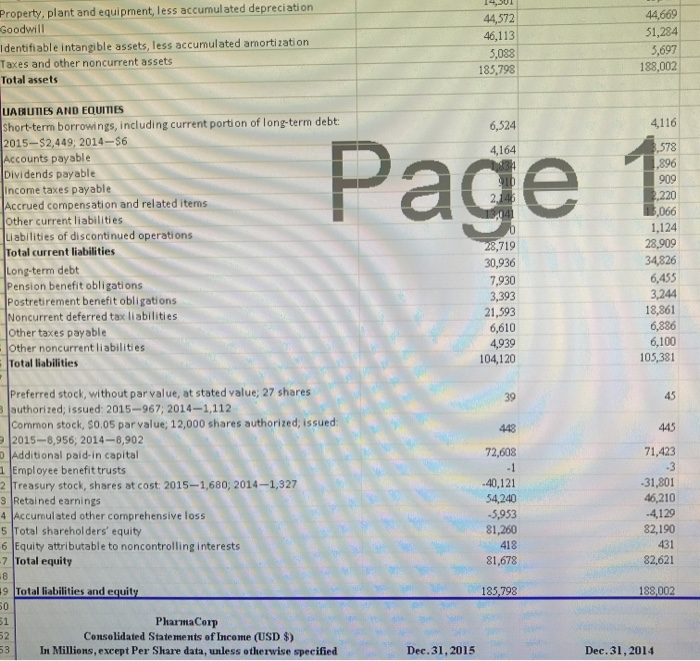
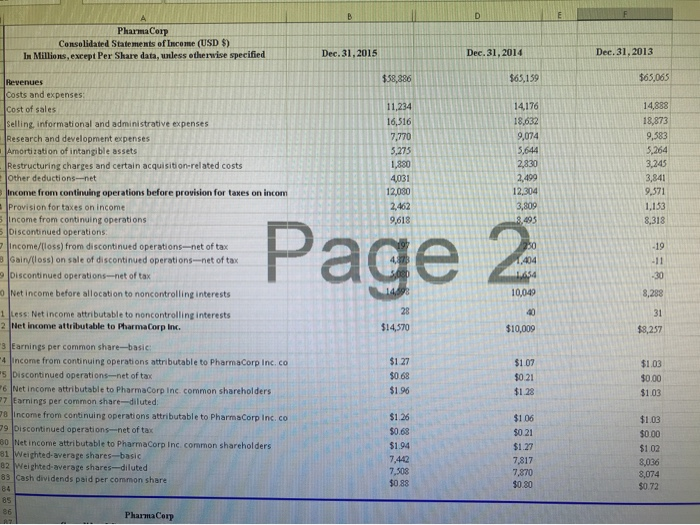
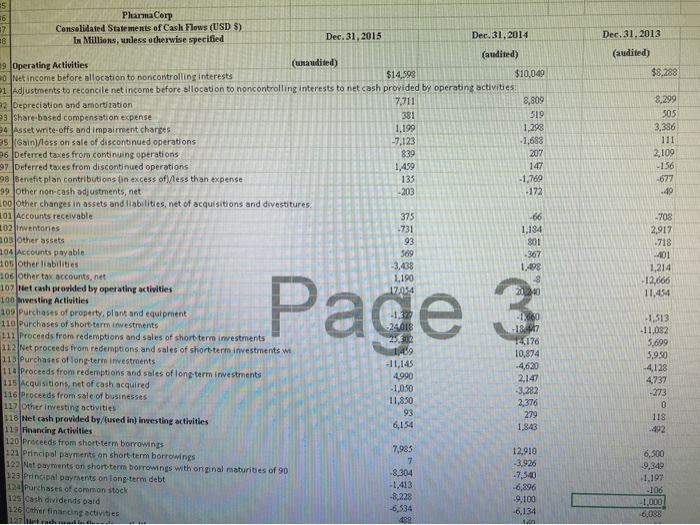
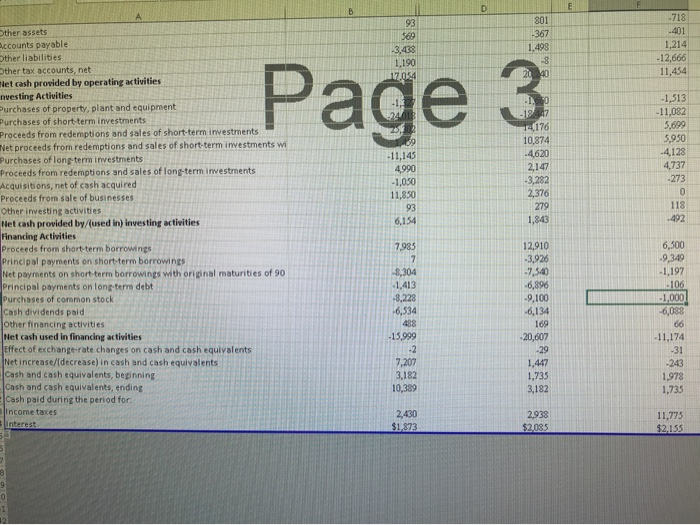
Reference the Excel file containing financial information from footnote disclosures and substantive analytical procedures using data analytics from your instructor. PharmaCorp will be used as the main analytical procedure tasks you will want to focus on for this assignment. The other companies, Novartell and AstraZoro, will be used as industry comparisons. The opportunity exists in this case to perform planning and substantive analytical procedures for accounts in the revenue.cycle. You may assume that the 2015 financial information is unaudited, but the information from 2014 has been audited.Consider the following trends and characteristics of the pharmaceutical industry and for PharmaCorp in particular as you work on this case: Following many years of dominant financial performance by companies in the United States, Europe and Canada, increased competition is arising from organizations in emerging economies such as Brazil, India, and China. Significant uncertainty exists in the industry due to regulation covering health-care and government reimbursements related to certain procedures and prescribed pharmaceuticals. Policy makers in the industry and governments incareasingly: Mandate necessary prescripts for patients o o Focus on prevention instead of treatment regimes, thereby leading to changes in demand for some products Anticipated growth in the industry is expected to be 5 % to 7% in 2016 compared with 456 to 596 in the prior year as stated by leading industry analysts Pharmacorp started and executed a signicant cast reduction initiative aimed at improving efficiency, reducing research and development.costs, and eliminating corporate overhead in 2014. PharmaCorp's credit policies has remained the same over the past several years. Their credit policies are considered stringent in their industry, and they have been criticized on accasion for these policies in relation to their competitors. Two of the companies most popular pharmaceuticals. Sistosis and Vigarvox, are no longer patented as of the last quarter of 2015 and are now facing competition from generic alternatives. Required: Partl: Planning Analytical Procedures 1.Step 1: Identify Proper Analytical Procedures. The senior auditor suggests you should use these ratios (on the financial statement level) for planning the analytical procedures as part of the revenue cycle at the company: Two of the companies most popular pharmaceuticals, Sistosis and Vigarvox, are no longer patented as of the last quarter of 2015 and are now facing competition from generic alternatives. Required: Part I: Planning Analytical Procedures 1.Step 1: Identify Proper Analytical Procedures. The senior auditor suggests you should use these ratios (on the financial statement level) for planning the analytical procedures as part of the revenue cycle at the company: a. Gross margin: (revenues-cost of sales)/revenues b. Turnover of receivalbles: (revenues/average accounts receivable); use the ending accounts receivable c. Receivables as a percentage of current assets: (accounts receivable/total current assets) d. Receivables as a percentage of total assets: (accounts receivable/total assets) e. Allowance for uncollectible accounts as a percentage of accounts receivable: (allowance/accounts receivable) f.Identify other relationships or trends that are relevant as part of the planning analytics. Discuss your reasons for your choices. 2.Step 2: Evaluate the Data Reliability When Developing Expectations. The data you will use to develop expectations in the revenue cycle has been deemed reliable by the audit staff. a. Discuss the likely factors the audit team will consider when making this determination. 3.Step 3: Develop expectations for accounts in the revenue cycle and for the ratios from Step # 1 that you deem as relevant. Since this is a planning analytical procedure, the expectations are not set at a high a high level of precision. Indicate if you expect a ratio to rise, fall, or remain the same, and explain the level of any anticipated rises or falls, or the range of the ratio. Pharma Corp's financial information is in the first tab of the Excel worksheet, while the information for Novartell and AstraZoro is available in the last two tabs of the file. a.Consider both historical trends of Pharmcorp and the industry on the whole. 4.Step 4 and Step 5: Define and Identify Substantial Unanticipated Variances. Refer to the text for guidance on materiality. a.Apply those guidelines to Step 4 of planning the analytical procedures as part of the revenue cycle for Pharmacorp.Define the meaning of a significant difference. Discuss your reasons for these choices. Discuss the qualitative materiality considerations in relation to this case. b.Once you have determined the levels of difference you would consider nateworthy, calculate the Step 1 ratios (and any additional trend or ration analysis you deemed necessary), based on Pharmacorp's financial statement figures. Identify the ratios where you expect a significant difference. 5.Step 6 and Step 7: Investigate Substantial Unanticipated Variances and Ensure Appropriate Documentation. a.Discuss the accounts or relationships you feel should be investigated further using substantive audit procedures. Discuss your reasons for these choices. b.Describe the information that should be a part of the auditor's report or files. Partll: Substantive Analytical Procedures 1. You will see three tabs in the Excel file that should be reviewed: the Pharmacorp Segment Information, Pharmacorp's Geographic Information, and Pharmacorp's Other Reyenue Information Thesetahr dicnlau qualitative materiality considerations in relation to this case. b.Once you have determined the levels of difference you would consider noteworthy, calculate the Step 1 ratios (and any additional trend or ration analysis you deemed necessary), based on Pharmacorp's financial statement figures. Identify the ratios where you expect a significant difference 5.Step 6 and Step 7: Investigate Substantial Unanticipated Variances and Ensure Appropriate Documentation. a. Discuss the accounts or relationships you feel should be investigated further using substantive audit procedures. Discuss your reasons for these choices. b.Describe the information that should be a part of the auditor's report or files Partll: Substantive Analytical Procedures 1. You will see three tabs in the Excel file that should be reviewed: the Pharmacorp Segment Information, Pharmacorp's Geagraphic Information, and Pharmacorp's Other Revenue Information. These tabs display excerpts from Pharma Corp's footnote disclosures regarding segment, geographic, and other revenue information. Examine these disclosures and discuss the operating segments and geographic regions where the company does business. 2.Which operating segments generate the most revenue for the company and may be considered the most important? Which regions are the most important to the organization from geographic standpoint? List the three most important products manufactured by Pharmacorp? Discuss any trends you notice in relation to revenue generation for each of these different categories. 3. Explain the different types of ratio analysis that could be conducted in substantive analytical procedures using the data from the segrment, geographic, and other revenue information. An example would be the R&D expenses as a percentage of revenues. How would these substantive analytics be different from the planning analytics? Discuss the trends and relationships that are relevant, and what are the implications in relation to further substantive testing? PharmaCorp Consolidated Balance Sheets (USD $) In Millions, except Share data, unless otherwise specified Dec. 31,2014 Dec.31,2015 (audited) (unaudited) ASSETS $10,489 $3,282 Cash and cash equival ents BShort-terminvestments 23,170 22,219 13,158 12,478 2015-$374; 2014-$226 6,510 9,480 5,217 60,917 9,914 6,963 9,196 .0 Inventories 1 Taxes and other current assets 2 Assets of discontinued operations and other assets held for sale 13 Total current assets 14 Long-term investments 15 Property, plant and equipment, less accumul ated depreciation 16 Goodwill 70 61,415 14,249 15,921 14,361 44,669 51,284 44572 46,113 17 Identifiable intangible assets, less accumulated amortization 18 Taxes and other noncurrent assets 19 Total assets 5,697 5,083 185,798 188,002 20 21 UABIUTIES AND EQUITIES Short-term borrowings, including current portion of long-term debt 22 2015-$2,449; 2014-$6 23 Accounts payable 24 Dividends payable 25 Income taxes payable 26 Accrued compensation and related iterns 27 Other current liabilities 28 Liabilities of discontinued operations 6,524 4,116 Page 3,578 ,896 4,164 909 2,220 ,066 146 13,041 1,124 28,909 34,826 28,719 30,936 29 Total current liabilities 30 Long-term debt 31 Pension benefit obligations 32 Postretirement benefit obligations 33 Noncurrent deferred tax liabilities 34 Other taxes payable 35 Other noncurrent liabilities 36 Total liabilities 7,930 6,455 3,244 18,861 6,886 6,100 105,381 3,393 21,593 6,610 4,939 104,120 87 Preferred stock, without par value, at stated value; 27 shares 38 authorized, issued: 2015-967; 2014-1,112 Common stock, $0.05 parvalue; 12,000 shares authorized; issued: 39 2015-8,956; 2014-8,902 40 Additional paid-in capital 41 Ermployee benefit trusts 39 45 443 445 72,608 71,423 -3 Property, plant and equipment, less accumulated depreciation Goodwill 44,669 51,284 44,572 46,113 Identifiable intangible assets, less accumulated amortization Taxes and other noncurrent assets 5,697 188,002 5,088 185,798 Total assets UABUIES AND EQUITIES Short-term borrowings, including current porti on of long-term debt 2015-$2,449; 2014-$6 Accounts payable Dividends payable Income taxes payable Accrued compensation and related items Other current liabilities Liabilities of discontinued operations Total current liabilities 4116 6,524 Page ,578 4,164 896 909 2,220 3,066 1,124 28,909 34,826 28,719 30,936 Long-term debt Pension benefit obligations Postretirement benefit obligations Noncurrent deferred tax liabilities Other taxes payable Other noncurrent liabilities Total liabilities 6,455 3,244 18,861 6,836 6,100 105,381 7,930 3,393 21,593 6,610 4,939 104,120 Preferred stock, without par value, at stated value; 27 shares Bauthorized; issued: 2015-967; 2014-1,112 Common stock, s0.05 par value; 12,000 shares authorized; issued: 92015-8,956, 2014-8,902 0 Additional paid-in capital 1Employee benefit trusts 2 Treasury stock, shares at cost: 2015-1,680; 2014-1,327 3 Retained earnings 4 Accumulated other cornprehensive loss 5 Total sharehol ders' equity 6 Equity attributable to noncontrollinginterests -7 Total equity 45 39 445 448 71,423 72,608 3 -31,801 46,210 -4129 82,190 40,121 54,240 -5,953 81,260 418 431 82,621 81,678 8 9 Total liabilities and equity 188,002 185,798 50 51 PharmaCerp Consolidated Statements of Income (USD $) 2 PharmaCorp Consolidated State ments of Income (USD $) In Millions, except Per Share data, unless otherwise specified Dec. 31, 2013 Dec.31,2014 Dec.31,2015 $65,065 $58,886 $65,159 Revenues Costs and expenses: 14,176 14,888 Cost of sales 11,234 18,632 18,873 16,516 Selling, informational and admini strative expenses Research and development expenses Amortization of intangible assets Restructuring charges and certain acquisition-related costs other deductions-net Income from continuing operations before provision for taxes on incom 9,074 9,583 7,770 5,264 3,245 3,644 5,275 1,800 2,830 2,499 12,304 3,841 4,031 9,571 12,080 2,462 3,809 Provision for taxes on income 5Income from continuing operations 5 Discontinued operations Income/(loss) from discontinued operations-net of tax 8 Gain/lloss) on sale of discontinued operations-net of tax 1,153 9,618 8,495 8,313 Page 2 -19 1,404 -11 9 Discontinued operations-net of tax LA54 -30 14098 Net income before allocation to noncontrolling interests 10,049 8,288 28 1 Less: Net income attributable to noncontrolling interests 2 Net income attributable to PharmaCorp Inc. 31 $14,570 $10,009 $8,257 3 Earnings per common share-basic 4 Income from continuing operations attributable to PharmaCorp Inc. co $1.27 $1.07 $1.03 s Discontinued operations-net of tax $0.68 $0.21 $0.00 6 Net income attributable to PharmaCorp Inc cormmon shareholders 7 Earnings per common share-diluted: $1.96 $1.28 $1.03 78 Income fron continuing operations attributable to PharmaCorp Inc. co 79 Discontinued operations-net of tax 80 Net income attributable to PharmaCorp Inc. common shareholders 81 Weighted-average shares-basic 82 Weighted-average shares-diluted 83 Cash dividends paid per common share $1.26 $106 $1.03 $0.68 $0.21 $0.00 $1.94 $1.27 $1.02 7,442 7,508 $0.88 7,817 7,870 $0.30 8,036 3,074 $0.72 84 85 86 Pharma Corp 5 Pharma Corp Conselidated Statements of Cash Flows (USD $) In Millions, unless otherwise specified 6 7 Dec.31,2014 Dec. 31,2013 Dec.31,2015 18 (audited) (audited) 19 Operating Activities 90 Net income before allocation to noncontrolling interests 1 Adjustments to reconcile net income before allocation to noncontrolling interests to net cash provided by operating activities: 2 Depreciation and amortization 93 Share-based compensation expense 4 Asset write-offs and impairment charges s Gain)/loss on sale of discontinued operations 96 Deferred taxes from continuing operations 97 Deferred taxes from discontinued operations 98 Benefit plan contributions (in excess ofless than expense 99 Other non-cash adjustments, net 00 Other changes in assets and liabilities, net of acquisitions and divestitures 101 Accounts receivable 102 Inventories 103 0ther assets (unaudited) $8,288 $10,049 $14,598 8,299 8,809 7,711 505 381 519 3,386 1,298 1,199 -7,123 -1,683 207 111 2,109 839 147 -156 1,459 135 -1,769 -677 -172 -203 49 375 -66 -703 -731 1,184 301 2,917 -718 93 104 Accounts payable 105 Other liabilities 106 0ther tax accounts, net 107 Net cash provided by operating activities 100 nvesting Activities 109 Purchases of property, plant and equipment 110 Purchases of short-term investments 111 Proceeds from redemptions and sales of short-term investments 112 Net proceeds from redemptions and sales of short-term investments wi 113 Purchases of long-term investrments 114 Proceeds from redemptions and sales of long-term investments 115 Acquisitions, net of cash acquired 116 Proceeds from sale of businesses 117 0ther investing activities 118 Net cash provided by/(used in) inwesting activities 119 Financing Activities 120 Proceeds from short-term borrowings 121 Principal payments on short-term borrowings 122 Net payments on short-terrm borrowings with original maturities of 90 123 Principal payments on long-term debt 124 Purchases of common stock 125 Cash dividends paid 126 Other financing activities 569 -367 401 1,214 -3,438 1,190 17.024 1,498 Page 12,666 11,454 20,240 -660 -18447 14176 -1,513 -11,082 24018 2530 1459 -11,145 4990 -1,050 5,699 5,950 -4128 4737 -273 10,874 4620 2,147 -3,282 2,376 11,350 93 279 118 6,154 1,843 492 7,985 12,910 .3,926 7,540 -6,896 -9,100 -6,134 6,500 -9,349 -8,304 -1,413 -8,228 -6,534 1,197 -106 -1,000 -6,088 127 Net cached in C 488 160 E P -718 801 93 401 ther assets Accounts payable Dther liabilities Dther tax accounts, net -367 369 1,214 -12,666 11,454 1,498 -3,438 1,190 Page 3 40 17.054 Net cash provided by operating activities nvesting Activities Purchases of property, plant and equipment Purchases of short-term investments Proceeds fron redemptions and sales of short-term investments Net proceeds from redemptions and sales of short-term investments w Purchases of long-term investments Proceeds from redemptions and sales of long-term investments Acquisitions, net of cash acquired Proceeds from sale of businesses Other investing activities Net cash provided by/(used in) investing activities Financing Activities Proceeds from short-term borrowngs Principal payments on short-term borrowings Net payments on short-term borrowings with original maturities of 90 Principal payments on long-term debt Purchases of common stock Cash dividends paid Other financing activities Net cash used in financing activities Effect of exchange-rate changes on cash and cash equivalents Net increase/(decrease) in cash and cash equivalents Cash and cash equivalents, beginning Cash and cash equivalents, ending Cash paid during the period for. Income taxes -1,513 -18 47 14176 -11,082 5,699 5,950 4128 4,737 10,874 4620 -11,145 2147 -3,282 2,376 4990 -1,030 11,850 -273 118 279 93 492 1,843 6,154 12,910 -3,926 7,540 6,896 -9,100 -6,134 6,500 9,349 7,985 7 -1,197 -106 8,304 1,413 -8,228 -6,534 -1,000 -6,088 488 169 66 -15999 20,607 -11,174 7 29 -31 1,447 1,735 3,182 7,207 3,182 10,389 -243 1,978 1,735 2,430 $1,873 2938 11,775 Interest $2,035 $2,155 PharmaCorp Geographic Information Revenues exceeded $500 million in each of 16 countries outside the US. in 2015 and 2014, and in each of 17 countries outside the U.S. in 2013. The U.S 5 and Japan were the only countries to contribute more than 10% oftotal revenue in 2015. The U.S. was the only country to contribute more than 10 % of total revenue in 2014 and 2013. 6 7 8 The following table provides revenues by geographic area Year Ended December 31 10 11 12 2013 13 (MILLIONS OF DOLLARS) 2014 2015 14 15 Revenues 16 17 United States $ 26,933 $ 28,855 $ 23,086 18 19 20 21 22 23 16,156 16,099 13,375 Developed Euroge Developed Rest of World 10,554 10,975 9,891 24 25 11,252 10,263 26 Emerging Markets 11,971 27 28 $ 65,259 $ 58,986 $ 65,165 Revenues 29 30 31 Reference the Excel file containing financial information from footnote disclosures and substantive analytical procedures using data analytics from your instructor. PharmaCorp will be used as the main analytical procedure tasks you will want to focus on for this assignment. The other companies, Novartell and AstraZoro, will be used as industry comparisons. The opportunity exists in this case to perform planning and substantive analytical procedures for accounts in the revenue.cycle. You may assume that the 2015 financial information is unaudited, but the information from 2014 has been audited.Consider the following trends and characteristics of the pharmaceutical industry and for PharmaCorp in particular as you work on this case: Following many years of dominant financial performance by companies in the United States, Europe and Canada, increased competition is arising from organizations in emerging economies such as Brazil, India, and China. Significant uncertainty exists in the industry due to regulation covering health-care and government reimbursements related to certain procedures and prescribed pharmaceuticals. Policy makers in the industry and governments incareasingly: Mandate necessary prescripts for patients o o Focus on prevention instead of treatment regimes, thereby leading to changes in demand for some products Anticipated growth in the industry is expected to be 5 % to 7% in 2016 compared with 456 to 596 in the prior year as stated by leading industry analysts Pharmacorp started and executed a signicant cast reduction initiative aimed at improving efficiency, reducing research and development.costs, and eliminating corporate overhead in 2014. PharmaCorp's credit policies has remained the same over the past several years. Their credit policies are considered stringent in their industry, and they have been criticized on accasion for these policies in relation to their competitors. Two of the companies most popular pharmaceuticals. Sistosis and Vigarvox, are no longer patented as of the last quarter of 2015 and are now facing competition from generic alternatives. Required: Partl: Planning Analytical Procedures 1.Step 1: Identify Proper Analytical Procedures. The senior auditor suggests you should use these ratios (on the financial statement level) for planning the analytical procedures as part of the revenue cycle at the company: Two of the companies most popular pharmaceuticals, Sistosis and Vigarvox, are no longer patented as of the last quarter of 2015 and are now facing competition from generic alternatives. Required: Part I: Planning Analytical Procedures 1.Step 1: Identify Proper Analytical Procedures. The senior auditor suggests you should use these ratios (on the financial statement level) for planning the analytical procedures as part of the revenue cycle at the company: a. Gross margin: (revenues-cost of sales)/revenues b. Turnover of receivalbles: (revenues/average accounts receivable); use the ending accounts receivable c. Receivables as a percentage of current assets: (accounts receivable/total current assets) d. Receivables as a percentage of total assets: (accounts receivable/total assets) e. Allowance for uncollectible accounts as a percentage of accounts receivable: (allowance/accounts receivable) f.Identify other relationships or trends that are relevant as part of the planning analytics. Discuss your reasons for your choices. 2.Step 2: Evaluate the Data Reliability When Developing Expectations. The data you will use to develop expectations in the revenue cycle has been deemed reliable by the audit staff. a. Discuss the likely factors the audit team will consider when making this determination. 3.Step 3: Develop expectations for accounts in the revenue cycle and for the ratios from Step # 1 that you deem as relevant. Since this is a planning analytical procedure, the expectations are not set at a high a high level of precision. Indicate if you expect a ratio to rise, fall, or remain the same, and explain the level of any anticipated rises or falls, or the range of the ratio. Pharma Corp's financial information is in the first tab of the Excel worksheet, while the information for Novartell and AstraZoro is available in the last two tabs of the file. a.Consider both historical trends of Pharmcorp and the industry on the whole. 4.Step 4 and Step 5: Define and Identify Substantial Unanticipated Variances. Refer to the text for guidance on materiality. a.Apply those guidelines to Step 4 of planning the analytical procedures as part of the revenue cycle for Pharmacorp.Define the meaning of a significant difference. Discuss your reasons for these choices. Discuss the qualitative materiality considerations in relation to this case. b.Once you have determined the levels of difference you would consider nateworthy, calculate the Step 1 ratios (and any additional trend or ration analysis you deemed necessary), based on Pharmacorp's financial statement figures. Identify the ratios where you expect a significant difference. 5.Step 6 and Step 7: Investigate Substantial Unanticipated Variances and Ensure Appropriate Documentation. a.Discuss the accounts or relationships you feel should be investigated further using substantive audit procedures. Discuss your reasons for these choices. b.Describe the information that should be a part of the auditor's report or files. Partll: Substantive Analytical Procedures 1. You will see three tabs in the Excel file that should be reviewed: the Pharmacorp Segment Information, Pharmacorp's Geographic Information, and Pharmacorp's Other Reyenue Information Thesetahr dicnlau qualitative materiality considerations in relation to this case. b.Once you have determined the levels of difference you would consider noteworthy, calculate the Step 1 ratios (and any additional trend or ration analysis you deemed necessary), based on Pharmacorp's financial statement figures. Identify the ratios where you expect a significant difference 5.Step 6 and Step 7: Investigate Substantial Unanticipated Variances and Ensure Appropriate Documentation. a. Discuss the accounts or relationships you feel should be investigated further using substantive audit procedures. Discuss your reasons for these choices. b.Describe the information that should be a part of the auditor's report or files Partll: Substantive Analytical Procedures 1. You will see three tabs in the Excel file that should be reviewed: the Pharmacorp Segment Information, Pharmacorp's Geagraphic Information, and Pharmacorp's Other Revenue Information. These tabs display excerpts from Pharma Corp's footnote disclosures regarding segment, geographic, and other revenue information. Examine these disclosures and discuss the operating segments and geographic regions where the company does business. 2.Which operating segments generate the most revenue for the company and may be considered the most important? Which regions are the most important to the organization from geographic standpoint? List the three most important products manufactured by Pharmacorp? Discuss any trends you notice in relation to revenue generation for each of these different categories. 3. Explain the different types of ratio analysis that could be conducted in substantive analytical procedures using the data from the segrment, geographic, and other revenue information. An example would be the R&D expenses as a percentage of revenues. How would these substantive analytics be different from the planning analytics? Discuss the trends and relationships that are relevant, and what are the implications in relation to further substantive testing? PharmaCorp Consolidated Balance Sheets (USD $) In Millions, except Share data, unless otherwise specified Dec. 31,2014 Dec.31,2015 (audited) (unaudited) ASSETS $10,489 $3,282 Cash and cash equival ents BShort-terminvestments 23,170 22,219 13,158 12,478 2015-$374; 2014-$226 6,510 9,480 5,217 60,917 9,914 6,963 9,196 .0 Inventories 1 Taxes and other current assets 2 Assets of discontinued operations and other assets held for sale 13 Total current assets 14 Long-term investments 15 Property, plant and equipment, less accumul ated depreciation 16 Goodwill 70 61,415 14,249 15,921 14,361 44,669 51,284 44572 46,113 17 Identifiable intangible assets, less accumulated amortization 18 Taxes and other noncurrent assets 19 Total assets 5,697 5,083 185,798 188,002 20 21 UABIUTIES AND EQUITIES Short-term borrowings, including current portion of long-term debt 22 2015-$2,449; 2014-$6 23 Accounts payable 24 Dividends payable 25 Income taxes payable 26 Accrued compensation and related iterns 27 Other current liabilities 28 Liabilities of discontinued operations 6,524 4,116 Page 3,578 ,896 4,164 909 2,220 ,066 146 13,041 1,124 28,909 34,826 28,719 30,936 29 Total current liabilities 30 Long-term debt 31 Pension benefit obligations 32 Postretirement benefit obligations 33 Noncurrent deferred tax liabilities 34 Other taxes payable 35 Other noncurrent liabilities 36 Total liabilities 7,930 6,455 3,244 18,861 6,886 6,100 105,381 3,393 21,593 6,610 4,939 104,120 87 Preferred stock, without par value, at stated value; 27 shares 38 authorized, issued: 2015-967; 2014-1,112 Common stock, $0.05 parvalue; 12,000 shares authorized; issued: 39 2015-8,956; 2014-8,902 40 Additional paid-in capital 41 Ermployee benefit trusts 39 45 443 445 72,608 71,423 -3 Property, plant and equipment, less accumulated depreciation Goodwill 44,669 51,284 44,572 46,113 Identifiable intangible assets, less accumulated amortization Taxes and other noncurrent assets 5,697 188,002 5,088 185,798 Total assets UABUIES AND EQUITIES Short-term borrowings, including current porti on of long-term debt 2015-$2,449; 2014-$6 Accounts payable Dividends payable Income taxes payable Accrued compensation and related items Other current liabilities Liabilities of discontinued operations Total current liabilities 4116 6,524 Page ,578 4,164 896 909 2,220 3,066 1,124 28,909 34,826 28,719 30,936 Long-term debt Pension benefit obligations Postretirement benefit obligations Noncurrent deferred tax liabilities Other taxes payable Other noncurrent liabilities Total liabilities 6,455 3,244 18,861 6,836 6,100 105,381 7,930 3,393 21,593 6,610 4,939 104,120 Preferred stock, without par value, at stated value; 27 shares Bauthorized; issued: 2015-967; 2014-1,112 Common stock, s0.05 par value; 12,000 shares authorized; issued: 92015-8,956, 2014-8,902 0 Additional paid-in capital 1Employee benefit trusts 2 Treasury stock, shares at cost: 2015-1,680; 2014-1,327 3 Retained earnings 4 Accumulated other cornprehensive loss 5 Total sharehol ders' equity 6 Equity attributable to noncontrollinginterests -7 Total equity 45 39 445 448 71,423 72,608 3 -31,801 46,210 -4129 82,190 40,121 54,240 -5,953 81,260 418 431 82,621 81,678 8 9 Total liabilities and equity 188,002 185,798 50 51 PharmaCerp Consolidated Statements of Income (USD $) 2 PharmaCorp Consolidated State ments of Income (USD $) In Millions, except Per Share data, unless otherwise specified Dec. 31, 2013 Dec.31,2014 Dec.31,2015 $65,065 $58,886 $65,159 Revenues Costs and expenses: 14,176 14,888 Cost of sales 11,234 18,632 18,873 16,516 Selling, informational and admini strative expenses Research and development expenses Amortization of intangible assets Restructuring charges and certain acquisition-related costs other deductions-net Income from continuing operations before provision for taxes on incom 9,074 9,583 7,770 5,264 3,245 3,644 5,275 1,800 2,830 2,499 12,304 3,841 4,031 9,571 12,080 2,462 3,809 Provision for taxes on income 5Income from continuing operations 5 Discontinued operations Income/(loss) from discontinued operations-net of tax 8 Gain/lloss) on sale of discontinued operations-net of tax 1,153 9,618 8,495 8,313 Page 2 -19 1,404 -11 9 Discontinued operations-net of tax LA54 -30 14098 Net income before allocation to noncontrolling interests 10,049 8,288 28 1 Less: Net income attributable to noncontrolling interests 2 Net income attributable to PharmaCorp Inc. 31 $14,570 $10,009 $8,257 3 Earnings per common share-basic 4 Income from continuing operations attributable to PharmaCorp Inc. co $1.27 $1.07 $1.03 s Discontinued operations-net of tax $0.68 $0.21 $0.00 6 Net income attributable to PharmaCorp Inc cormmon shareholders 7 Earnings per common share-diluted: $1.96 $1.28 $1.03 78 Income fron continuing operations attributable to PharmaCorp Inc. co 79 Discontinued operations-net of tax 80 Net income attributable to PharmaCorp Inc. common shareholders 81 Weighted-average shares-basic 82 Weighted-average shares-diluted 83 Cash dividends paid per common share $1.26 $106 $1.03 $0.68 $0.21 $0.00 $1.94 $1.27 $1.02 7,442 7,508 $0.88 7,817 7,870 $0.30 8,036 3,074 $0.72 84 85 86 Pharma Corp 5 Pharma Corp Conselidated Statements of Cash Flows (USD $) In Millions, unless otherwise specified 6 7 Dec.31,2014 Dec. 31,2013 Dec.31,2015 18 (audited) (audited) 19 Operating Activities 90 Net income before allocation to noncontrolling interests 1 Adjustments to reconcile net income before allocation to noncontrolling interests to net cash provided by operating activities: 2 Depreciation and amortization 93 Share-based compensation expense 4 Asset write-offs and impairment charges s Gain)/loss on sale of discontinued operations 96 Deferred taxes from continuing operations 97 Deferred taxes from discontinued operations 98 Benefit plan contributions (in excess ofless than expense 99 Other non-cash adjustments, net 00 Other changes in assets and liabilities, net of acquisitions and divestitures 101 Accounts receivable 102 Inventories 103 0ther assets (unaudited) $8,288 $10,049 $14,598 8,299 8,809 7,711 505 381 519 3,386 1,298 1,199 -7,123 -1,683 207 111 2,109 839 147 -156 1,459 135 -1,769 -677 -172 -203 49 375 -66 -703 -731 1,184 301 2,917 -718 93 104 Accounts payable 105 Other liabilities 106 0ther tax accounts, net 107 Net cash provided by operating activities 100 nvesting Activities 109 Purchases of property, plant and equipment 110 Purchases of short-term investments 111 Proceeds from redemptions and sales of short-term investments 112 Net proceeds from redemptions and sales of short-term investments wi 113 Purchases of long-term investrments 114 Proceeds from redemptions and sales of long-term investments 115 Acquisitions, net of cash acquired 116 Proceeds from sale of businesses 117 0ther investing activities 118 Net cash provided by/(used in) inwesting activities 119 Financing Activities 120 Proceeds from short-term borrowings 121 Principal payments on short-term borrowings 122 Net payments on short-terrm borrowings with original maturities of 90 123 Principal payments on long-term debt 124 Purchases of common stock 125 Cash dividends paid 126 Other financing activities 569 -367 401 1,214 -3,438 1,190 17.024 1,498 Page 12,666 11,454 20,240 -660 -18447 14176 -1,513 -11,082 24018 2530 1459 -11,145 4990 -1,050 5,699 5,950 -4128 4737 -273 10,874 4620 2,147 -3,282 2,376 11,350 93 279 118 6,154 1,843 492 7,985 12,910 .3,926 7,540 -6,896 -9,100 -6,134 6,500 -9,349 -8,304 -1,413 -8,228 -6,534 1,197 -106 -1,000 -6,088 127 Net cached in C 488 160 E P -718 801 93 401 ther assets Accounts payable Dther liabilities Dther tax accounts, net -367 369 1,214 -12,666 11,454 1,498 -3,438 1,190 Page 3 40 17.054 Net cash provided by operating activities nvesting Activities Purchases of property, plant and equipment Purchases of short-term investments Proceeds fron redemptions and sales of short-term investments Net proceeds from redemptions and sales of short-term investments w Purchases of long-term investments Proceeds from redemptions and sales of long-term investments Acquisitions, net of cash acquired Proceeds from sale of businesses Other investing activities Net cash provided by/(used in) investing activities Financing Activities Proceeds from short-term borrowngs Principal payments on short-term borrowings Net payments on short-term borrowings with original maturities of 90 Principal payments on long-term debt Purchases of common stock Cash dividends paid Other financing activities Net cash used in financing activities Effect of exchange-rate changes on cash and cash equivalents Net increase/(decrease) in cash and cash equivalents Cash and cash equivalents, beginning Cash and cash equivalents, ending Cash paid during the period for. Income taxes -1,513 -18 47 14176 -11,082 5,699 5,950 4128 4,737 10,874 4620 -11,145 2147 -3,282 2,376 4990 -1,030 11,850 -273 118 279 93 492 1,843 6,154 12,910 -3,926 7,540 6,896 -9,100 -6,134 6,500 9,349 7,985 7 -1,197 -106 8,304 1,413 -8,228 -6,534 -1,000 -6,088 488 169 66 -15999 20,607 -11,174 7 29 -31 1,447 1,735 3,182 7,207 3,182 10,389 -243 1,978 1,735 2,430 $1,873 2938 11,775 Interest $2,035 $2,155 PharmaCorp Geographic Information Revenues exceeded $500 million in each of 16 countries outside the US. in 2015 and 2014, and in each of 17 countries outside the U.S. in 2013. The U.S 5 and Japan were the only countries to contribute more than 10% oftotal revenue in 2015. The U.S. was the only country to contribute more than 10 % of total revenue in 2014 and 2013. 6 7 8 The following table provides revenues by geographic area Year Ended December 31 10 11 12 2013 13 (MILLIONS OF DOLLARS) 2014 2015 14 15 Revenues 16 17 United States $ 26,933 $ 28,855 $ 23,086 18 19 20 21 22 23 16,156 16,099 13,375 Developed Euroge Developed Rest of World 10,554 10,975 9,891 24 25 11,252 10,263 26 Emerging Markets 11,971 27 28 $ 65,259 $ 58,986 $ 65,165 Revenues 29 30 31