Answered step by step
Verified Expert Solution
Link Copied!

Question

1 Approved Answer

Region Country of thom (US) Level Sub Industry Curr USD Com Group Dynamics Vs Sell 1Yr Low Analysis of MS US Multiples - Premium to
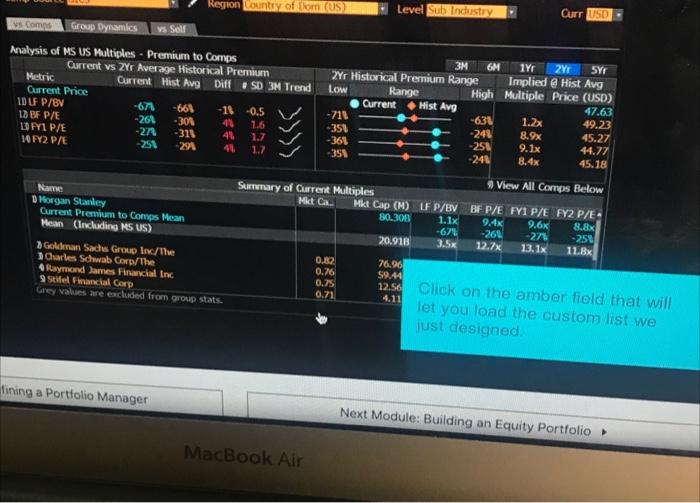
image text in transcribed
Region Country of thom (US) Level Sub Industry Curr USD Com Group Dynamics Vs Sell 1Yr Low Analysis of MS US Multiples - Premium to Comps Current vs Yr Average Historical Premium Metric Current Hist. Avg Diff SD 3M Trend Current Price IDLE P/BV -67 -661 -11-0.5 12 BF P/E -261 -30% 41 LDP1 P/E -27 -311 41 1.7 10 FY2 P/E -251 291 41 1.7 3M 6M 2Y! SYT 2Yr Historical Premium Range Implied @ Hist Avg Range High Multiple Price (USD) Current Mist Avg 47.63 -711 -631 1.2x 49.23 -351 -241 45.27 -361 -251 9.1x 44.77 -351 -24 8.4x 45.18 16 >>>> 8.9% View All Comps Below Summary of Current Multiples Mkt Ca Mkt Cap (H)LF P/BV 80.306 1.1x -67 20.91B 3.5x Name D Morgan Stanley Current Premium to Comps Mean Mean (including MS US) 2 Goldman Sachs Group Inc/The 1 Charles Schwab Corp/The Raymond James Financial Inc 9 Stifel Financial Corp Grey values are excluded from group stats. BF P/E FY1 P/E FY2 P/E- 9.4% 9.6K 8.8x -26 -27 -250 12.7% 13.1x 1LBX 0.82 0.76 0.75 0.71 76.96 59.44 4.11 12.5. Click on the amber field that will let you load the custom list we just designed fining a Portfolio Manager Next Module: Building an Equity Portfolio MacBook Air Region Country of thom (US) Level Sub Industry Curr USD Com Group Dynamics Vs Sell 1Yr Low Analysis of MS US Multiples - Premium to Comps Current vs Yr Average Historical Premium Metric Current Hist. Avg Diff SD 3M Trend Current Price IDLE P/BV -67 -661 -11-0.5 12 BF P/E -261 -30% 41 LDP1 P/E -27 -311 41 1.7 10 FY2 P/E -251 291 41 1.7 3M 6M 2Y! SYT 2Yr Historical Premium Range Implied @ Hist Avg Range High Multiple Price (USD) Current Mist Avg 47.63 -711 -631 1.2x 49.23 -351 -241 45.27 -361 -251 9.1x 44.77 -351 -24 8.4x 45.18 16 >>>> 8.9% View All Comps Below Summary of Current Multiples Mkt Ca Mkt Cap (H)LF P/BV 80.306 1.1x -67 20.91B 3.5x Name D Morgan Stanley Current Premium to Comps Mean Mean (including MS US) 2 Goldman Sachs Group Inc/The 1 Charles Schwab Corp/The Raymond James Financial Inc 9 Stifel Financial Corp Grey values are excluded from group stats. BF P/E FY1 P/E FY2 P/E- 9.4% 9.6K 8.8x -26 -27 -250 12.7% 13.1x 1LBX 0.82 0.76 0.75 0.71 76.96 59.44 4.11 12.5. Click on the amber field that will let you load the custom list we just designed fining a Portfolio Manager Next Module: Building an Equity Portfolio MacBook Air

Step by Step Solution

There are 3 Steps involved in it

Step: 1

blur-text-image

Get Instant Access to Expert-Tailored Solutions

See step-by-step solutions with expert insights and AI powered tools for academic success

Step: 2

blur-text-image

Step: 3

blur-text-image

Ace Your Homework with AI

Get the answers you need in no time with our AI-driven, step-by-step assistance

Get Started

Recommended Textbook for

States And The Reemergence Of Global Finance

Authors: Eric Helleiner

1st Edition

0801428599, 978-0801428593

More Books

Students also viewed these Finance questions