

Answered step by step
Verified Expert Solution
Question
1 Approved Answer
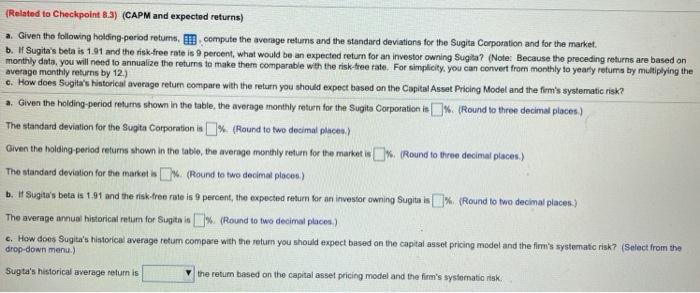
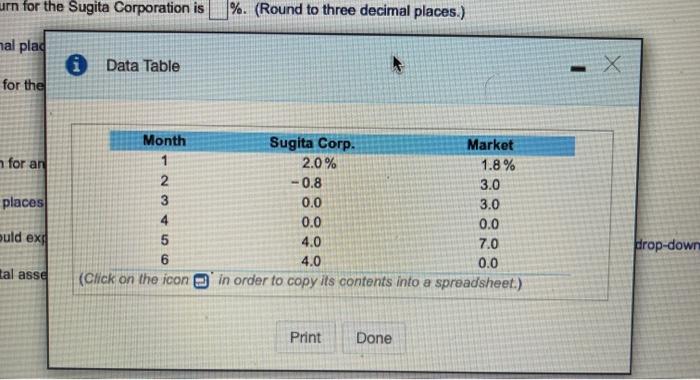
(Related to Checkpoint 8.3) (CAPM and expected returns) a. Given the following holding period retums, compute the average returns and the standard deviations for the
Step by Step Solution
There are 3 Steps involved in it
Step: 1

Get Instant Access to Expert-Tailored Solutions
See step-by-step solutions with expert insights and AI powered tools for academic success
Step: 2

Step: 3
Ace Your Homework with AI
Get the answers you need in no time with our AI-driven, step-by-step assistance
Get Started
Big Money Thinks Small Biases Blind Spots And Smarter Investing
Authors: Joel Tillinghast
1st Edition
023117571X, 978-0231175715