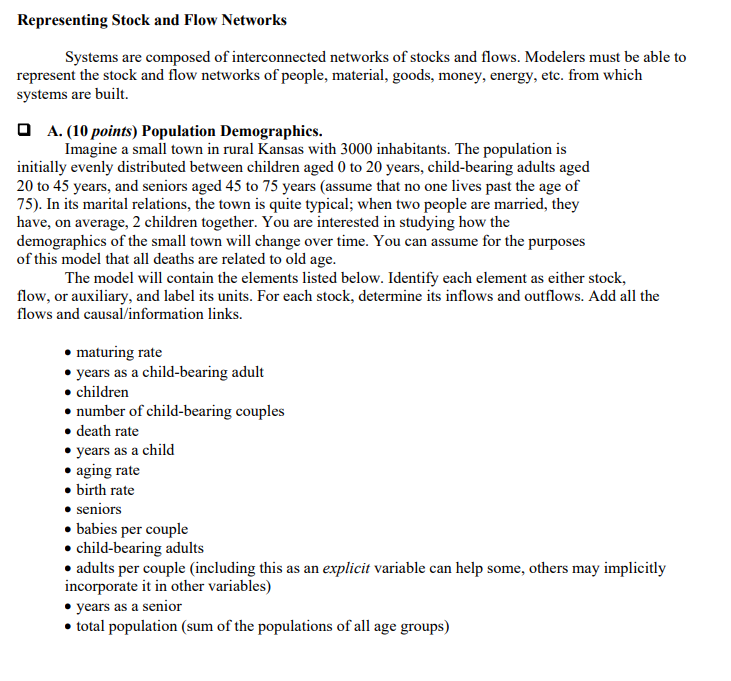
Representing Stock and Flow Networks Systems are composed of interconnected networks of stocks and flows. Modelers must be able to represent the stock and flow networks of people, material, goods, money, energy, etc. from which systems are built A. (10 points) Population Demographics. Imagine a small town in rural Kansas with 3000 inhabitants. The population is initially evenly distributed between children aged 0 to 20 years, child-bearing adults aged 20 to 45 years, and seniors aged 45 to 75 years (assume that no one lives past the age of 75). In its marital relations, the town is quite typical; when two people are married, they have, on average, 2 children together. You are interested in studying how the demographics of the small town will change over time. You can assume for the purposes of this model that all deaths are related to old age. The model will contain the elements listed below. Identify each element as either stock, flow, or auxiliary, and label its units. For each stock, determine its inflows and outflows. Add all the flows and causal/information links. maturing rate years as a child-bearing adult children number of child-bearing couples death rate years as a child aging rate birth rate seniors babies per couple child-bearing adults adults per couple (including this as an explicit variable can help some, others may implicitly incorporate it in other variables) years as a senior total population (sum of the populations of all age groups) Representing Stock and Flow Networks Systems are composed of interconnected networks of stocks and flows. Modelers must be able to represent the stock and flow networks of people, material, goods, money, energy, etc. from which systems are built A. (10 points) Population Demographics. Imagine a small town in rural Kansas with 3000 inhabitants. The population is initially evenly distributed between children aged 0 to 20 years, child-bearing adults aged 20 to 45 years, and seniors aged 45 to 75 years (assume that no one lives past the age of 75). In its marital relations, the town is quite typical; when two people are married, they have, on average, 2 children together. You are interested in studying how the demographics of the small town will change over time. You can assume for the purposes of this model that all deaths are related to old age. The model will contain the elements listed below. Identify each element as either stock, flow, or auxiliary, and label its units. For each stock, determine its inflows and outflows. Add all the flows and causal/information links. maturing rate years as a child-bearing adult children number of child-bearing couples death rate years as a child aging rate birth rate seniors babies per couple child-bearing adults adults per couple (including this as an explicit variable can help some, others may implicitly incorporate it in other variables) years as a senior total population (sum of the populations of all age groups)


