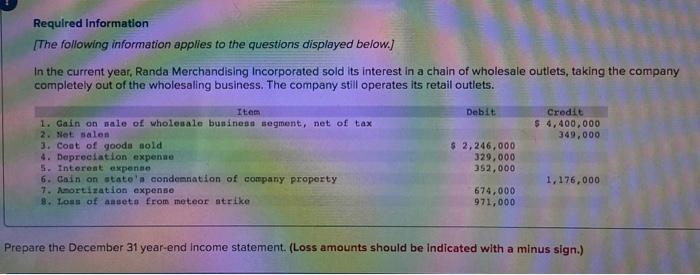
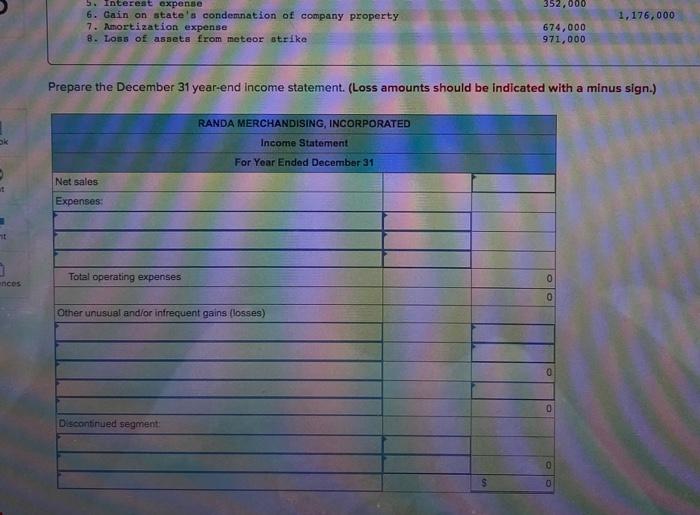
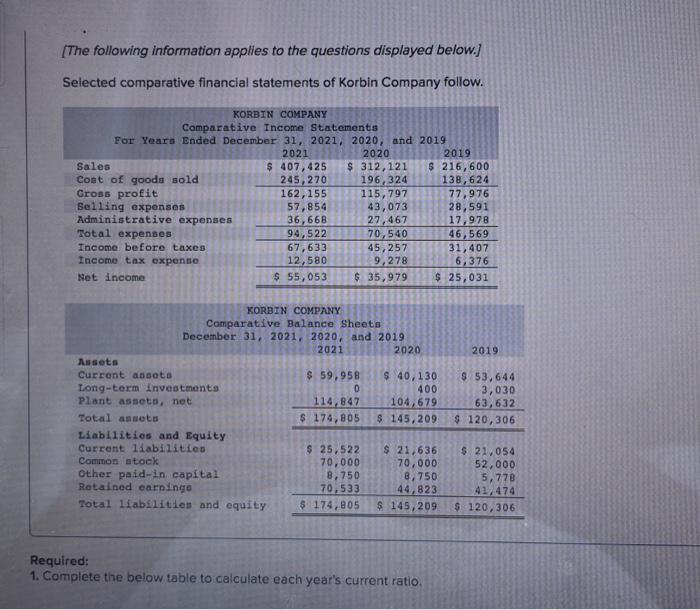
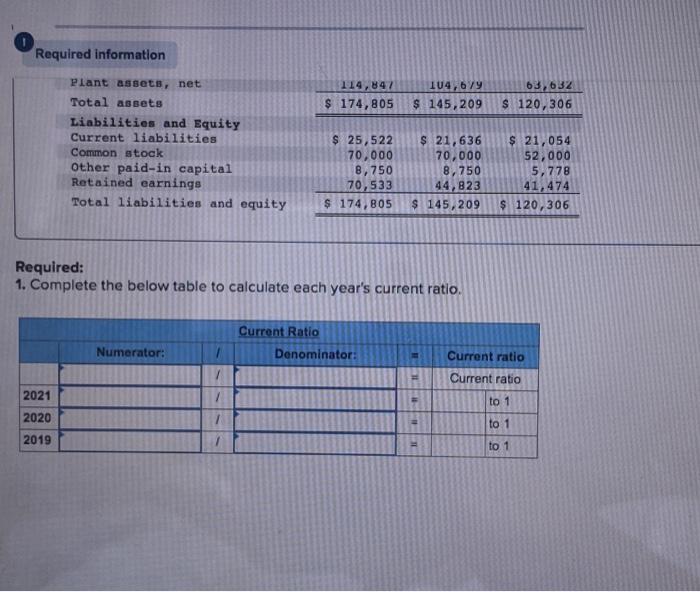
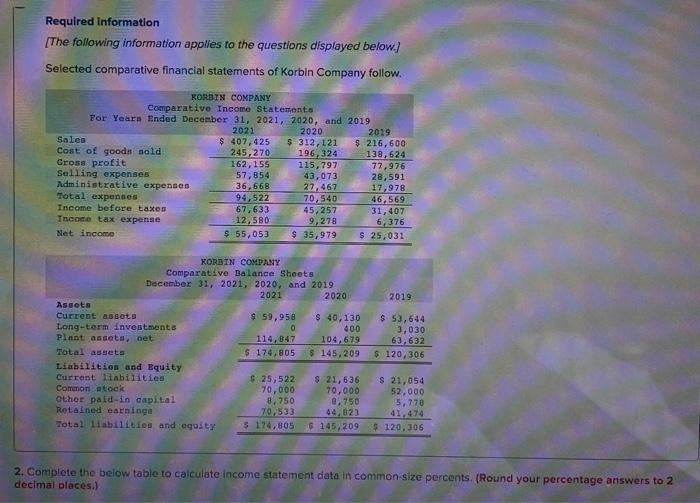
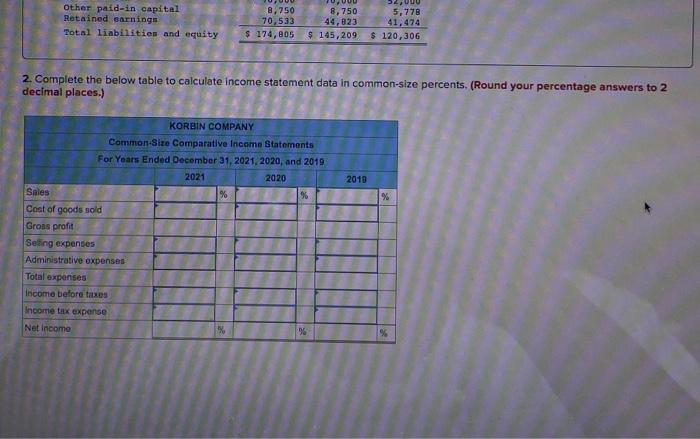
Required Information [The following information applies to the questions displayed below.) In the current year, Randa Merchandising Incorporated sold its interest in a chain of wholesale outlets, taking the company completely out of the wholesaling business. The company still operates its retail outlets. Debit Credit $4,400,000 349,000 Item 1. Gain on sale of wholesale business segment, net of tax 2. Net salon 3. Coat of goods sold 4. Depreciation expenne 5. Interest expense 6. Cain on state'a condemnation of company property 1. Amortisation expense 8. Loss of assets from meteor strike $ 2,246.000 329,000 352,000 1,176,000 674,000 971,000 Prepare the December 31 year-end Income statement. (Loss amounts should be indicated with a minus sign.) 352.000 1,176,000 5. Interest expense 6. Gain on state's condemnation of company property 7. Amortization expense 8. Loss of assets from meteor strike 674,000 971,000 Prepare the December 31 year-end income statement. (Loss amounts should be indicated with a minus sign.) RANDA MERCHANDISING, INCORPORATED ok Income Statement For Year Ended December 31 Net sales Expenses: Total operating expenses 0 ences 0 Other unusual and/or infrequent gains (losses) 0 0 Discontinued segment: 0 0 The following information applies to the questions displayed below.) Selected comparative financial statements of Korbin Company follow. KORBIN COMPANY Comparative Income Statements For Years Ended December 31, 2021, 2020, and 2019 2021 2020 2019 Sales $ 407,425 $ 312, 121 $ 216, 600 Cost of goods sold 245,270 196,324 138,624 Gross profit 162,155 115,797 77,976 Selling expenses 57,854 43,073 28,591 Administrative expenses 36,668 27,467 17,978 Total expenses 94,522 70,540 46,569 Income before taxes 67,633 45,257 31,407 Income tax expense 12,580 9,278 6,376 Net income $ 55,053 $ 35,979 $ 25,031 2019 KORBIN COMPANY Comparative Balance Sheets December 31, 2021, 2020, and 2019 2021 2020 Assets Current assets $ 59,958 $ 40, 130 Long-term Investments 0 400 Plant asseto, net 114,847 104.679 Total anseta $ 174,805 $ 145,209 Liabilities and Equity Current liabilities $ 25,522 $ 21.636 Common stock 70,000 70,000 Other paid-in capital 8,750 8,750 Retained earnings 70,533 44,823 Total liabilities and equity $ 174,805 $ 145,209 $ 53,644 3,030 63,632 $ 120,306 $ 21,054 52,000 5,778 41,474 $ 120, 306 Required: 1. Complete the below table to calculate each year's current ratio. Required information 114,847 $ 174,805 114,679 $ 145,209 63.632 $ 120, 306 Plant assets, net Total assets Liabilities and Equity Current liabilities Common stock Other paid-in capital Retained earnings Total liabilities and equity $ 25,522 70,000 B, 750 70,533 $ 174,805 $ 21,636 70,000 8,750 44,823 $ 145,209 $ 21,054 52,000 5,778 41,474 $ 120, 306 Required: 1. Complete the below table to calculate each year's current ratio. Current Ratio Denominator: Numerator: Current ratio Current ratio 2021 to 1 2020 to 1 2019 to 1 Required information [The following information applies to the questions displayed below.) Selected comparative financial statements of Korbin Company follow. KORBIN COMPANY Comparative Income Statements For Years Ended December 31, 2021, 2020, and 2019 2021 2020 2019 Sales $ 407,425 $ 312, 121 $ 216, 600 Cost of goods sold 245,270 196,324 138,624 Cross profit 162,155 115,797 77,976 Selling expenses 57,854 43,073 28,591 Administrative expenses 36,668 27,467 17,978 Total expenses 94,522 70,540 46.569 Income before taxes 67,633 45,257 31, 407 Income tax expense 12.580 9,278 6,376 Net income $ 55,053 $ 35,979 $ 25,031 2019 KORBIN COMPANY Comparative Balance Shoots December 31, 2021 2020, and 2019 2021 2020 Assets Current assota $ 59,958 $ 40,130 Long-term investments 400 Plant assets. net 114,947 104, 679 Total assets $ 174,805 $ 145,209 Liabilities and Equity Current liabilities $ 25,522 $ 21,636 Common stock 70,000 70,000 Other paid-in capital 8.750 0.750 Rotained earnings 20,533 44,823 Total liabilities and equity 5 174,805 6 145,209 $ 53,644 3,030 63,632 $ 120, 306 $ 21,054 52.000 5,770 $ 120, 306 2. Complete the below table to calculate income statement data in common-size percents (Round your percentage answers to 2 decimal places.) Other paid in capital Retained earnings Total liabilities and equity 8.750 70.533 $ 174,805 8,750 44,823 $ 145,209 32.000 5,778 41,474 $ 120,306 2. Complete the below table to calculate income statement data in common-size percents. (Round your percentage answers to 2 decimal places.) 2010 % KORBIN COMPANY Common Size Comparative Income Statements For Years Ended December 31, 2021, 2020, and 2019 2021 2020 Sales % % Cost of goods sold Gross profit Selling expenses Administrative expenses Total expenses Income before taxes Income tax expense Net Income
