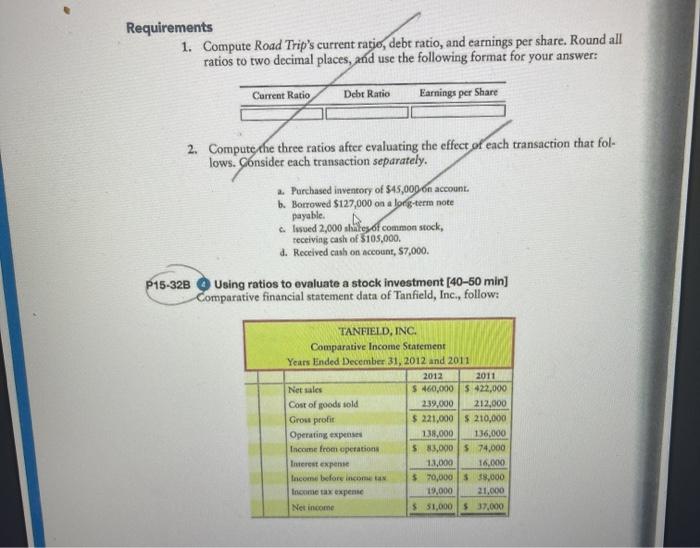
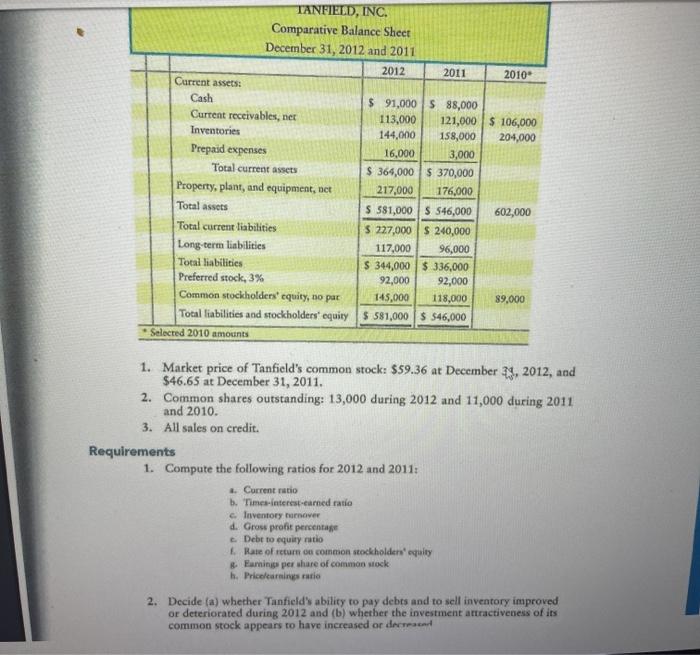
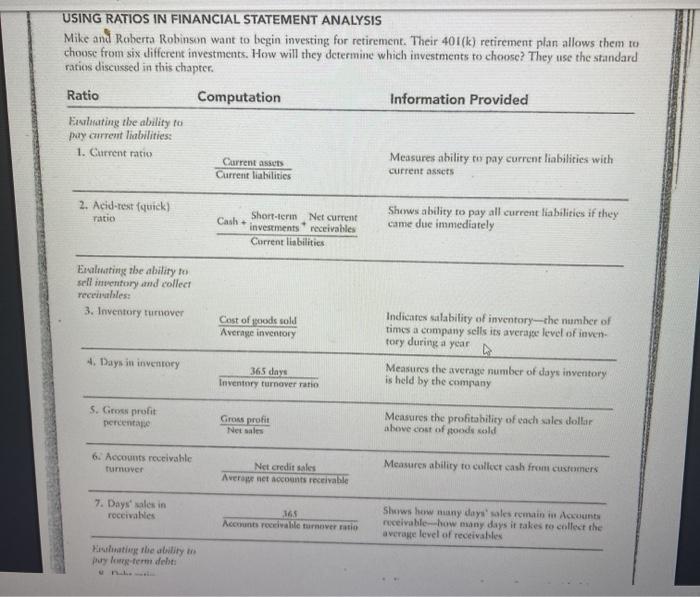
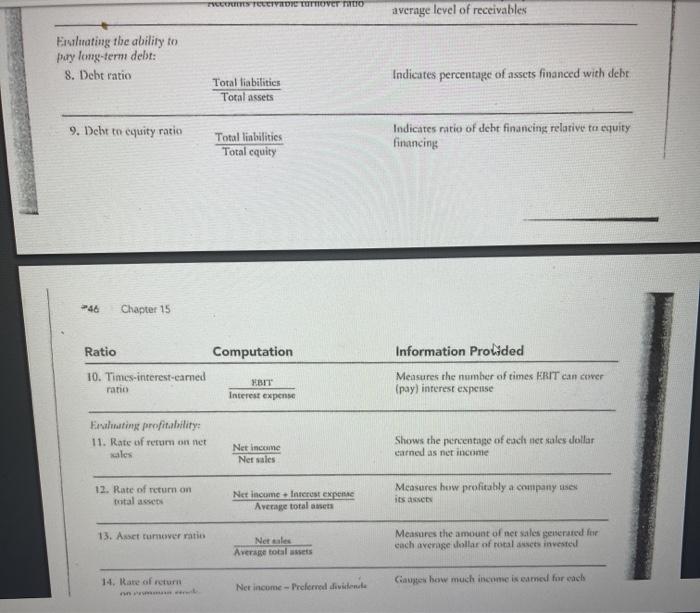
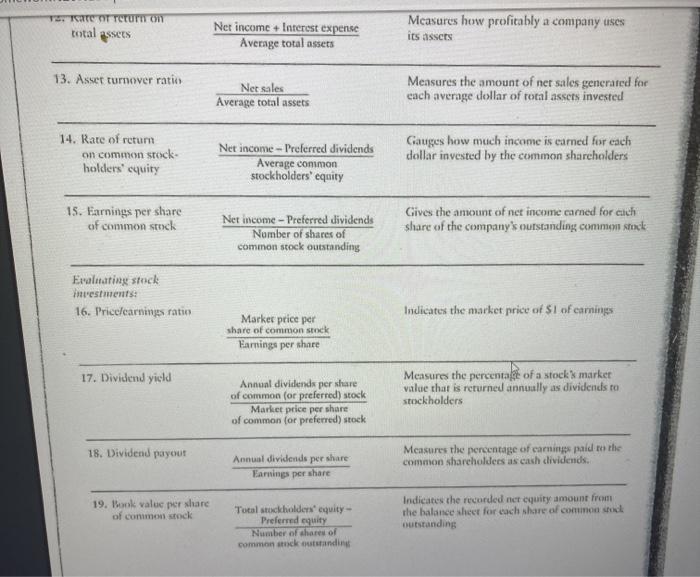
Requirements 1. Compute Road Trip's current ratie, debt ratio, and earnings per share. Round all ratios to two decimal places, and use the following format for your answer: Current Ratio Debt Ratio Earnings per Share 2. Compute the three ratios after evaluating the effect of each transaction that fol- lows. Consider cach transaction separately. a. Purchased inventory of 545,000 on account. b. Borrowed $127,000 on a long-term note payable. Clwed 2,000 states of common stock, receiving cash of $105,000 d. Received cash on account, $7,000. P15-32B Using ratios to evaluate a stock investment (40-50 min) Comparative financial statement data of Tanfield, Inc., follow: TANFIELD, INC. Comparative Income Statement Years Ended December 31, 2012 and 2011 2012 2011 Net sales S 460,000 5 422,000 Cost of goods sold 239,000 212,000 Grou profit $ 221,000 $ 210,000 Operating expen 138,000 136,000 Income from operations $ 83.000 74.000 Interest expense 13,000 16.000 Income before income a $70,000 8,000 Income tax expense 19,000 21,000 Net income $ 51,000$ 37,000 TANFIELD, INC. Comparative Balance Sheet December 31, 2012 and 2011 2012 2011 2010 Current assets: Cash $ 91,000 $ 88,000 Curtent receivables, net 113,000 121,000 $ 106,000 Inventories 144,000 158,000 204,000 Prepaid expenses 16,000 3,000 Total current assets $ 364,000$ 370,000 Property, plant, and equipment, net 217,000 176,000 Total assets $ 581,000 S 546,000 602,000 Total current liabilities $ 227,000 $ 240,000 Long-term liabilities 117,000 96,000 Total liabilities $ 344,000 $336,000 Preferred stock, 3% 92,000 92,000 Common stockholders' equity, 10 par 145,000 118,000 89,000 Total liabilities and stockholders' equity $ 581,000 $ $46,000 Stlected 2010 amounts 1. Market price of Tanfield's common stock: $59.36 at December 29, 2012, and $46.65 at December 31, 2011. 2. Common shares outstanding: 13,000 during 2012 and 11,000 during 2011 and 2010. 3. All sales on credit. Requirements 1. Compute the following ratios for 2012 and 2011: Current ratio b. Times-interest-earned ratio Inventory traver d. Gross profit percentage Debt to equiry natio 1. Rate of return on common stockholders' equity Burning per share of common stock h. Pricelearnings ratio 2. Decide (a) whether Tanfield's ability to pay debts and to sell inventory improved or deteriorated during 2012 and (b) whether the investment attractiveness of its common stock appears to have increased or decreased USING RATIOS IN FINANCIAL STATEMENT ANALYSIS Mike and Roberta Robinson want to begin investing for retirement. Their 401(k) retirement plan allows them to choose from six different investments. How will they determine which investments to choose? They use the standard ratis discussed in this chapter. Ratio Computation Information Provided Espluating the ability to pay current liabilities: 1. Current ratio Measures ability to pay current liabilities with Current liabilities current assets Current assets 2. Acid-test fquick) ratio Cash Short-term Net current investments receivables Current liabilities Shows ability to pay all current liabilities if they came due immediately Evaluating the ability to sell inventory and collect receivables: 3. Inventory tumover Cost of foods sold Average inventory Indicates salability of inventory--the number of times a company sells its average level of inven tory during a year a Measures the average number of days inventory is held by the company 4. Days in inventory 365 days Inventory turnover ratio S. Gross profit percentage Gross profit Net sales Measures the profitability of each sales dollar above cost of goods sold 6. Accounts receivable rumover Net credit sales Avernet counts receivable Measures ability to collect cash from customers 7. Days' sales in roceivables 165 Accounts receivable turnover ratio Shows how many days' sales remain in Account receivable how many days it takes to collect the average level of receivables Kate the ability in Duy low-term delt: TAITES TELETVRDIE TUITIOVET TUTTO average level of receivables Evaluating the ability to pay long-term debt: 8. Debt ratio Indicates percentage of assets financed with debt. Total liabilities Total assets 9. Dcht to equity ratio Total liabilities Total equity Indicates ratio of deht financing relative to equity financing -46 Chapter 15 Ratio Computation Information Prolided 10. Times-interest-camed rano EBIT Measures the number of times ERIT cancer (pay) interest expense Interest expense Felting profitability 11. Rate of retum on net sales Net Income Net sales Shows the percentage of each ner sales dollar carned as net income 12. Rate of return on total assets Net Income Interest expone Average total assets Measures how profitably a company sex its a 13. Asset turnover ratin Net als Average totalets Measures the amount of net sales generated for cach average dollar of rotalasses investe 14. Rate of return Net income - Preferred dividende Gauge how much income is named for each TO TATOOT return on total assets Net income + Interest expense Average total assets Measures how profitably a company uses its assets 13. Asset turnover ratio Ner sales Average total assets Measures the amount of net sales generated for each average dollar of total assets invested 14. Rate of return on common srock holders' cquity Net income -- Preferred dividends Average common stockholders' equity Gauges how much income is earned for each dollar invested by the common shareholders 15. Earnings per share of common stock Net income - Preferred dividends Nomber of shares of common stock outstanding Gives the amount of net income cared for cich share of the company's outstanding common stock Evaluating stock investments: 16. Pricelearnings ratio Indicates the market price of $1 of earnings Market price per share of common stock Earnings per share 17. Dividend yield Annual dividends per share of common (or preferred) stock Market price per share of common (or preferred) stock Measures the percentat of a stock market value that is returned annually as dividends to stockholders 18. Dividend payout Annual dividends per share Earnings por share Measures the percentage of earning paid to the common shareholders as cash dividends. 19. Book value per share of common stock Total stockholders equity- Preferred equity Number of shares of common scoutstanding Indicates the recorded ner equiry amount from the balance sheet for each share of common stock outstanding
