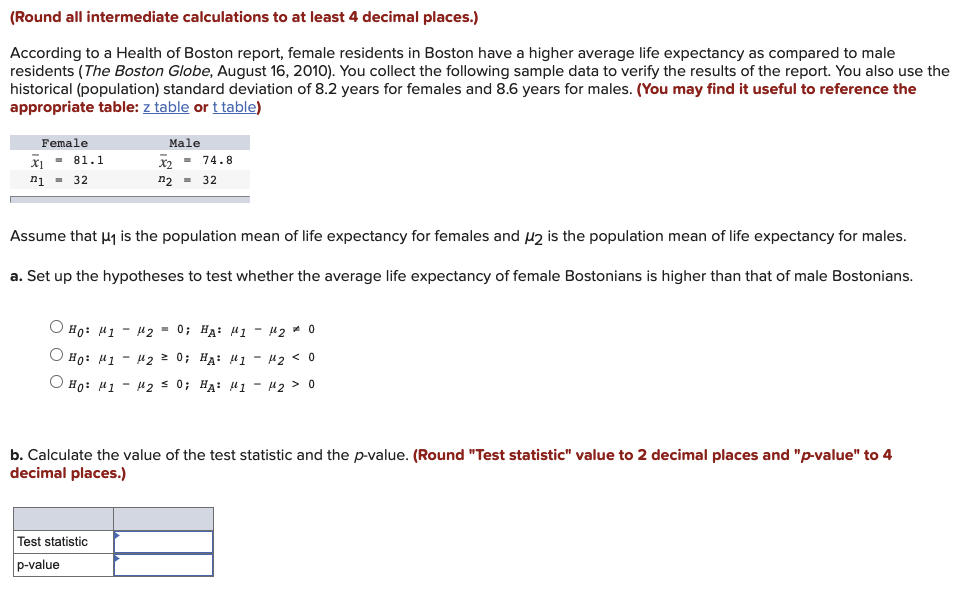
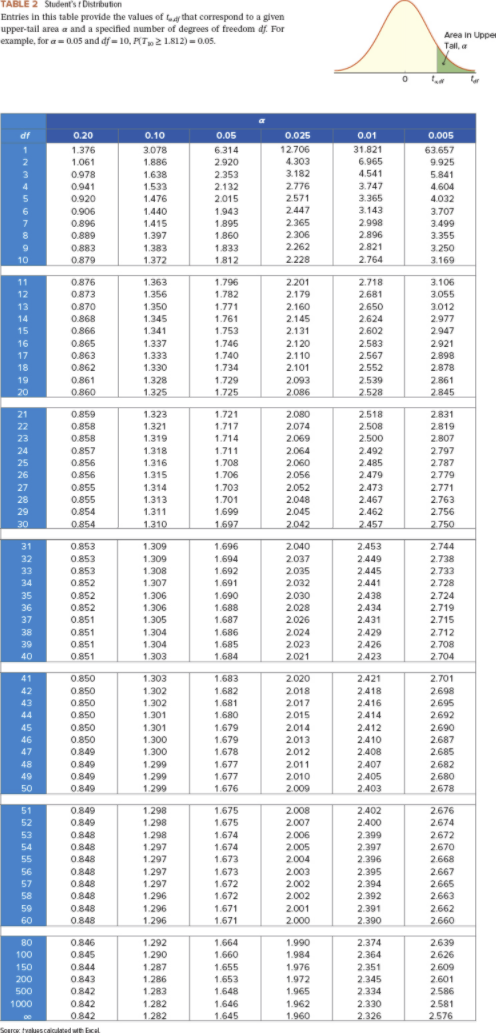
(Round all intermediate calculations to at least 4 decimal places.) According to a Health of Boston report, female residents in Boston have a higher average life expectancy as compared to male residents (The Boston Globe, August 16, 2010). You collect the following sample data to verify the results of the report. You also use the historical (population) standard deviation of 8.2 years for females and 8.6 years for males. (You may find it useful to reference the appropriate table: z table or t table) Female Male *1 81.1 x2 - 74.8 21 = 32 n2 - 32 Assume that M1 is the population mean of life expectancy for females and /2 is the population mean of life expectancy for males. a. Set up the hypotheses to test whether the average life expectancy of female Bostonians is higher than that of male Bostonians. OH0: 1 - M2 = 0; HA: #1 - H2 0 OHo: #1 - M2 2 0; HA: 1 1 - 12 0 b. Calculate the value of the test statistic and the p-value. (Round "Test statistic" value to 2 decimal places and "p-value" to 4 decimal places.) Test statistic p-valueTABLE 2 Student's f Distribution Entries In this table provide the values of try that correspond to a given upper-tail area a and a specified number of degrees of freedom df. For example, for a = 0.05 and of = 10, PUT , 2 1.812) = 0.05. Area In Upper Tall, a 0 0.20 0.10 0.05 0.025 0.01 0,005 1.376 3.078 6.314 12.706 31.821 63.657 1.061 1.886 2.920 4.303 6.965 9.925 0.978 1.638 2.353 3.182 4.541 5.841 0.941 1.533 2.132 2776 3.747 4.604 0.920 1.476 2.015 2571 3.365 4.032 0.906 1.440 1.943 2447 3.143 3.707 0.896 1.415 1.895 2.365 2.998 3.499 0.889 1.397 1.860 2.306 2.896 3.355 0.883 1.383 1.833 2.262 2.821 3.250 0.879 1.372 1.812 2.228 2.764 3.169 11 0.876 1.363 1.796 2.201 2.718 3.106 0.873 1.356 1.782 2.179 2.681 3.055 13 0.870 1.350 1.771 2.160 2.650 3.012 14 0.868 1.345 1.761 2.145 2.624 2.977 15 0.866 1.341 1.753 2.131 2.602 2.947 16 0.865 1.337 1.746 2.120 2.583 2.921 17 0.863 1.333 1.740 2.110 2.567 2.898 18 0.862 1.330 1.734 2.101 2.552 2.878 19 0.861 1.328 1.729 2.093 2.539 2.861 0.860 1.325 1.725 2.086 2.528 2.845 0.859 1.323 1.721 2.080 2.518 2.831 INNY 0.858 1.321 1.717 2.074 2.508 2.819 0.858 1.319 1.714 2.069 2.500 2.807 24 0.857 1.318 1.711 2.064 2.492 2.797 25 0.856 1.316 1.708 2.060 2.485 2.787 26 0.856 1.315 1.706 2.056 2.479 2.779 27 0.855 1.314 1.703 2.052 2.473 2771 28 0.855 1.313 1.701 2.048 2.467 2.763 29 0.854 1.311 1.699 2.045 2.462 2.756 30 0.854 1.310 1.697 2.042 2.457 2.750 31 0.853 1.309 1.696 2.040 2.453 2.744 32 0.853 1.309 1.694 2.037 2.449 2.738 33 0.853 1.308 1.692 2.035 2.445 2.733 34 0.852 1.307 1.691 2.032 2.441 2.728 35 0.852 1.306 1.690 2.030 2.438 2.724 36 0.852 1.306 1.688 2.028 2.434 2.719 37 0.851 1.305 1.687 2.026 2.431 2.715 38 0.851 1.304 1.686 2024 2.429 2.712 39 0.851 1.304 1.685 2.023 2.426 2.708 40 0.851 1.303 1.684 2.021 2.423 2.704 41 0.850 1.303 1.683 2.020 2.421 2.701 42 0.850 1.302 1.682 2018 2.418 2.698 43 0.850 1.302 1.681 2017 2.416 2.695 44 0.850 1.301 1.680 2015 2.414 2.692 45 0.850 1.301 1.679 2.014 2.412 2.690 46 0.850 1.300 1.679 2013 2.410 2.687 47 0.849 1.300 1.678 2.012 2.408 2.685 48 0.849 1.299 1.677 2011 2.407 2.682 49 0.849 1.299 1.677 2.010 2.405 2.680 50 0.849 1.290 1.676 2 009 2.403 2.678 51 0.849 1.298 1.675 2.008 2.402 2.676 52 0.849 1.298 1.675 2.007 2.400 2.674 53 0.848 1.298 1.674 2.006 2.399 2.672 54 0.848 1.297 1.674 2.005 2.397 2.670 55 0.848 1.297 1.673 2.004 2.396 2.668 56 0.848 1.297 1.673 2.003 2.395 2.667 57 0.848 1.297 1.672 2.002 2.394 2.665 58 0.848 1.296 1.672 2002 2.392 2.663 59 0.848 1.296 1.671 2.001 2.391 2.662 60 0.848 1.296 1.671 2.000 2.390 2.660 0.846 1.292 1.664 1.990 2.374 2.639 100 0.845 1.290 1.660 1.984 2.364 2.626 150 0.844 1.287 1.655 1.976 2.351 2.609 200 0.843 1.286 1.653 1.972 2.345 2.601 500 0.842 1.283 1.648 1.965 2.334 2.586 1000 0.842 1.282 1.646 1.962 2.330 2.581 0.842 1.282 1.645 1.960 2.326 2.576


