Answered step by step
Verified Expert Solution
Question
1 Approved Answer
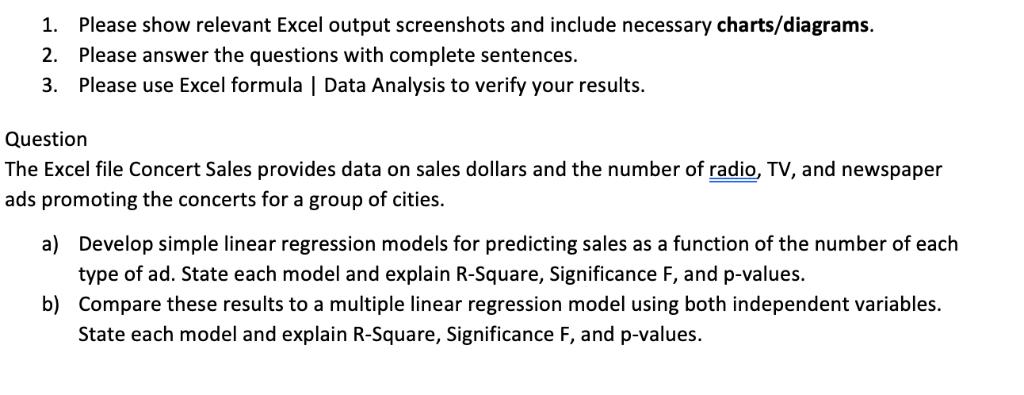
1. Please show relevant Excel output screenshots and include necessary charts/diagrams. 2. Please answer the questions with complete sentences. 3. Please use Excel formula


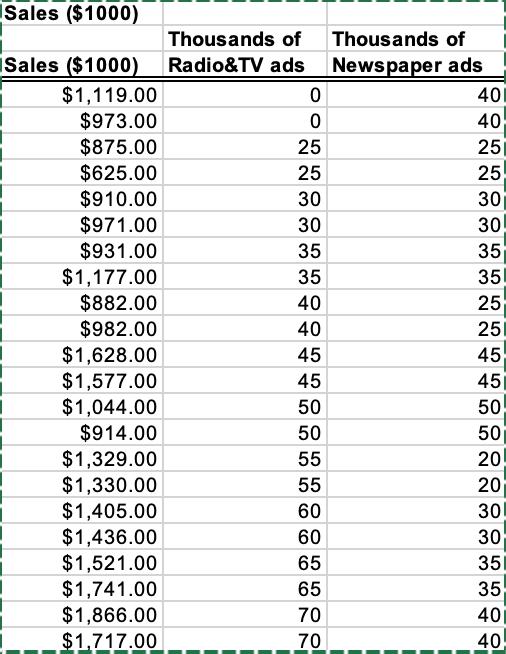
1. Please show relevant Excel output screenshots and include necessary charts/diagrams. 2. Please answer the questions with complete sentences. 3. Please use Excel formula | Data Analysis to verify your results. Question The Excel file Concert Sales provides data on sales dollars and the number of radio, TV, and newspaper ads promoting the concerts for a group of cities. a) Develop simple linear regression models for predicting sales as a function of the number of each type of ad. State each model and explain R-Square, Significance F, and p-values. b) Compare these results to a multiple linear regression model using both independent variables. State each model and explain R-Square, Significance F, and p-values. Sales ($1000) Sales ($1000) $1,119.00 $973.00 $875.00 $625.00 $910.00 $971.00 $931.00 $1,177.00 $882.00 $982.00 $1,628.00 $1,577.00 $1,044.00 $914.00 $1,329.00 $1,330.00 $1,405.00 $1,436.00 $1,521.00 $1,741.00 $1,866.00 $1,717.00 Thousands of Radio&TV ads 0 0 25 25 30 30 35 35 40 40 45 45 50 50 55 55 60 60 65 65 70 70 Thousands of Newspaper ads 40 40 25 25 30 30 35 35 25 25 45 45 50 50 20 20 30 30 351 35 40 40
Step by Step Solution
★★★★★
3.49 Rating (162 Votes )
There are 3 Steps involved in it
Step: 1
a Running a simple linear regression for predicting Sales using Radio TV as the predictor From From ...
Get Instant Access to Expert-Tailored Solutions
See step-by-step solutions with expert insights and AI powered tools for academic success
Step: 2

Step: 3

Ace Your Homework with AI
Get the answers you need in no time with our AI-driven, step-by-step assistance
Get Started


