

Answered step by step
Verified Expert Solution
Question
1 Approved Answer
Select the graph that matches the numbered manufacturing cost data. Indicate by letter which graph best fits the situation or item described. (Click to view
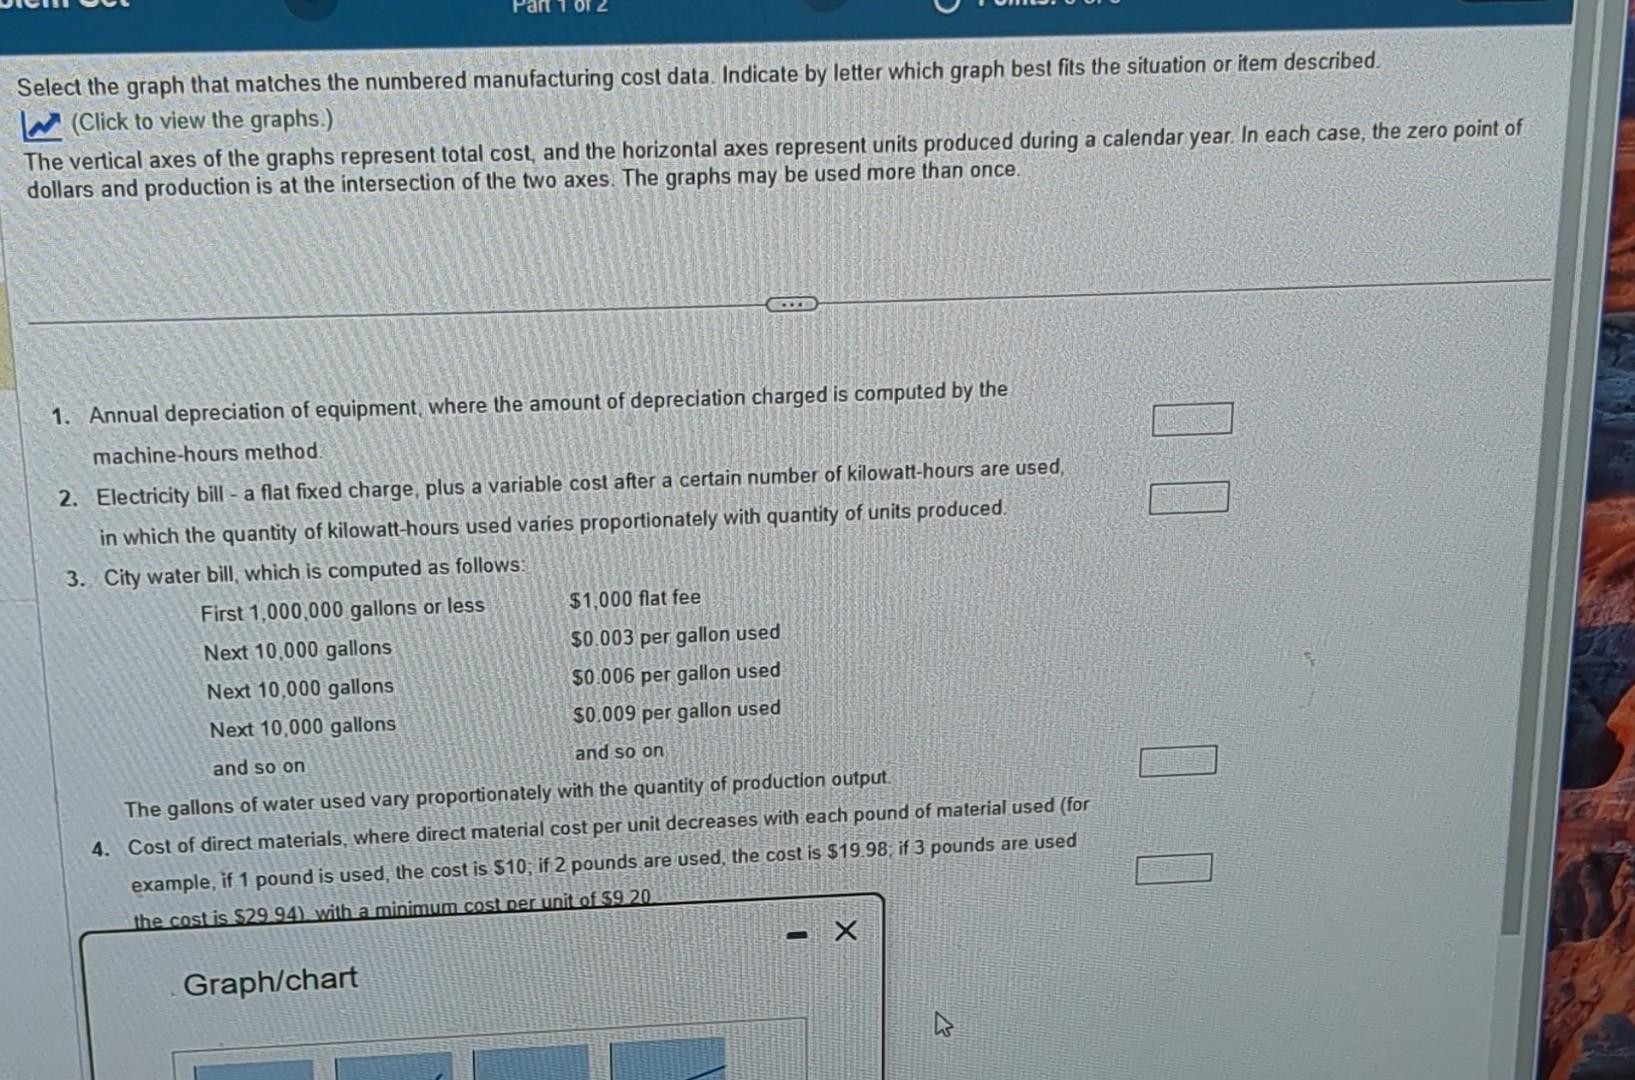
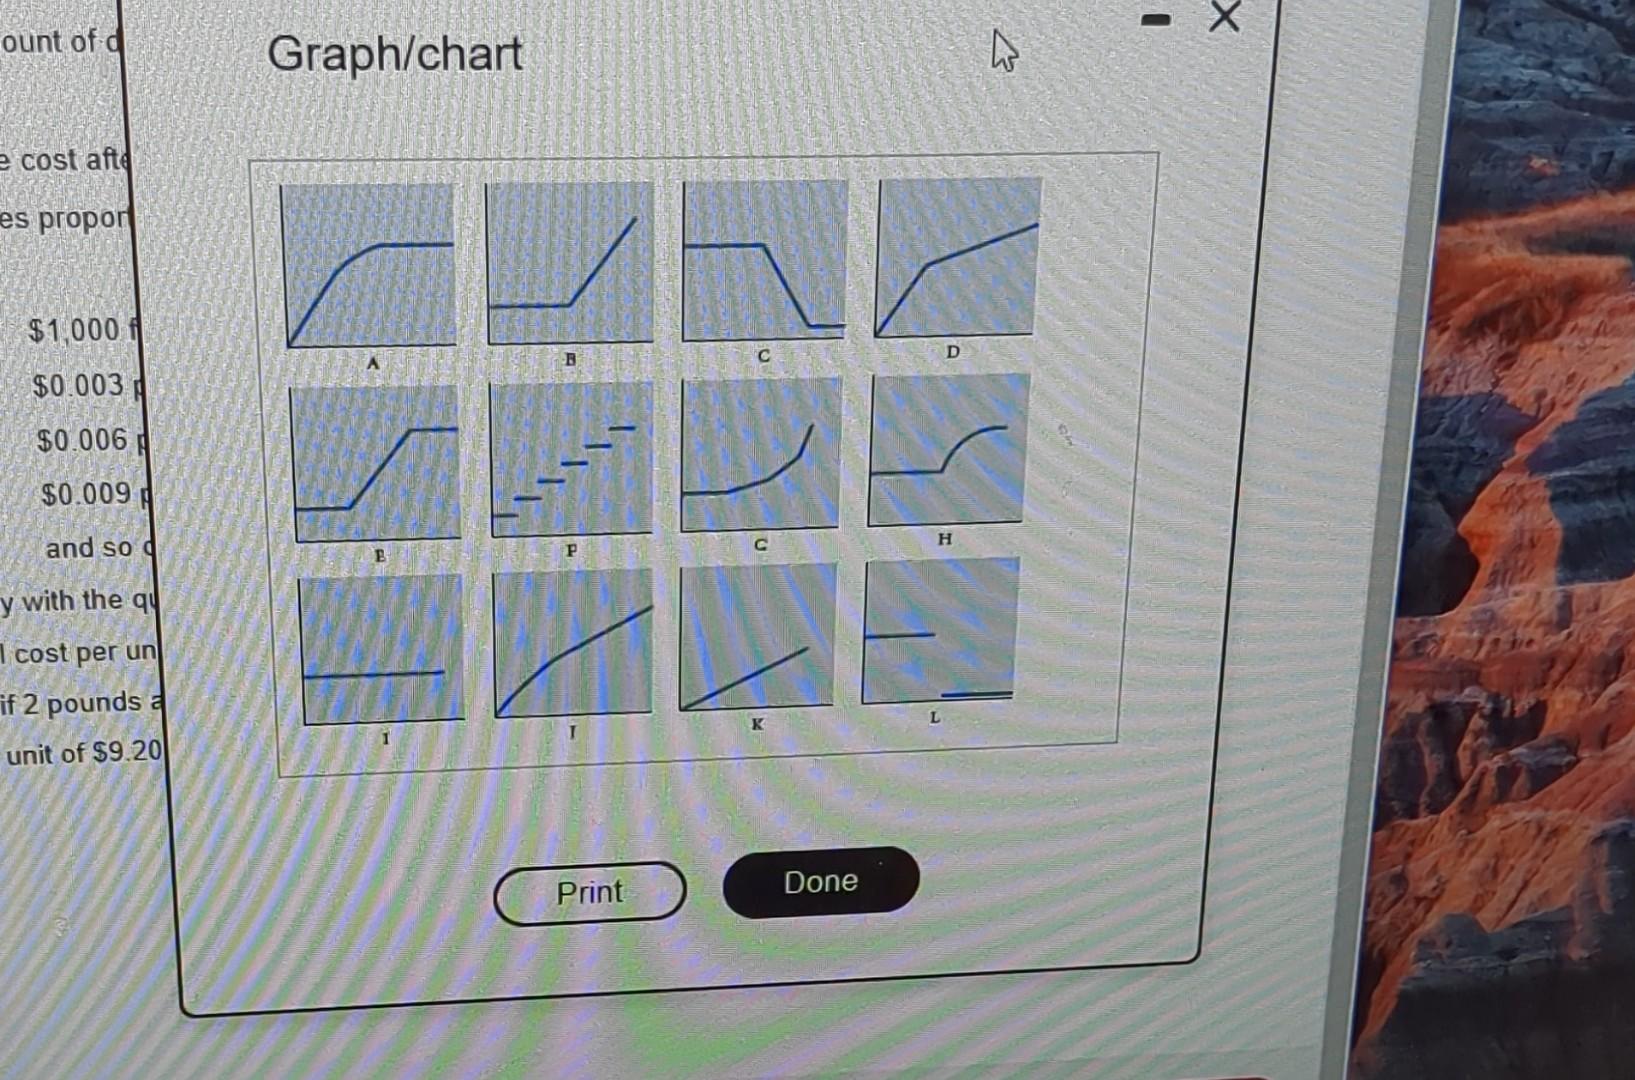
Select the graph that matches the numbered manufacturing cost data. Indicate by letter which graph best fits the situation or item described. (Click to view the graphs.) The vertical axes of the graphs represent total cost, and the horizontal axes represent units produced during a calendar year. In each case, the zero point of dollars and production is at the intersection of the two axes. The graphs may be used more than once. 1. Annual depreciation of equipment, where the amount of depreciation charged is computed by the machine-hours method. 2. Electricity bill - a flat fixed charge, plus a variable cost after a certain number of kilowatt-hours are used, in which the quantity of kilowatt-hours used varies proportionately with quantity of units produced. 3. City watar hill which is computed as follows: The gallons of water used vary proportionately with the quantity of procuction output. 4. Cost of direct materials, where direct material cost per unit decreases with each pound of material used (for example, if 1 pound is used, the cost is $10; if 2 pounds are used, the cost is $19.98; if 3 pounds are used Graph/chart
Step by Step Solution
There are 3 Steps involved in it
Step: 1

Get Instant Access to Expert-Tailored Solutions
See step-by-step solutions with expert insights and AI powered tools for academic success
Step: 2

Step: 3
Ace Your Homework with AI
Get the answers you need in no time with our AI-driven, step-by-step assistance
Get Started
Residential Energy Audit Manual
Authors: Fairmont
1st Edition
0915586541, 978-0915586547