Answered step by step
Verified Expert Solution
Question
1 Approved Answer
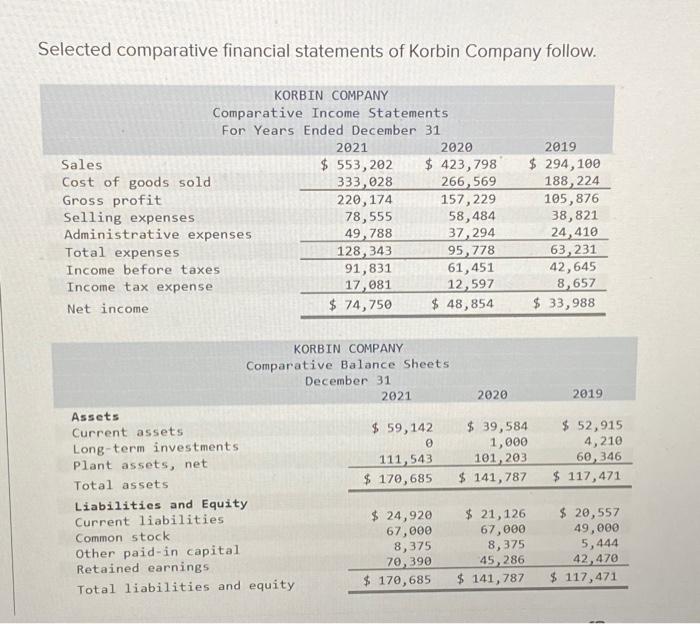
Selected comparative financial statements of Korbin Company follow. KORBIN COMPANY Comparative Income Statements For Years Ended December 31 Sales Cost of goods sold Gross profit
Selected comparative financial statements of Korbin Company follow. KORBIN COMPANY Comparative Income Statements For Years Ended December 31 Sales Cost of goods sold Gross profit Selling expenses Administrative expenses To expenses Income before taxes Income tax expense Net income Assets Current assets. Long-term investments Plant assets, net Total assets Liabilities and Equity Current liabilities 2021 2020 $ 553,202 $ 423,798 333,028 266,569 220,174 157, 229 78,555 58,484 49,788 37,294 Common stock Other paid-in capital Retained earnings Total liabilities and equity 128,343 91,831 17,081 $ 74,750 KORBIN COMPANY Comparative Balance Sheets December 31 95,778 61,451 12,597 $48,854 2021 $ 59,142 0 111,543 $ 170,685 $ 24,920 67,000 8,375 70,390 $ 170,685 2020 $ 39,584 1,000 101,203 $141,787 $ 21,126 67,000 8,375 45,286 $141,787 2019 $ 294,100 188,224 105,876 38,821 24,410 63,231 42,645 8,657 $ 33,988 2019 $ 52,915 4,210 60,346 $ 117,471 $ 20,557 49,000 5,444 42,470 $ 117,471


Step by Step Solution
There are 3 Steps involved in it
Step: 1

Get Instant Access to Expert-Tailored Solutions
See step-by-step solutions with expert insights and AI powered tools for academic success
Step: 2

Step: 3

Ace Your Homework with AI
Get the answers you need in no time with our AI-driven, step-by-step assistance
Get Started


