Answered step by step
Verified Expert Solution
Link Copied!

Question

1 Approved Answer

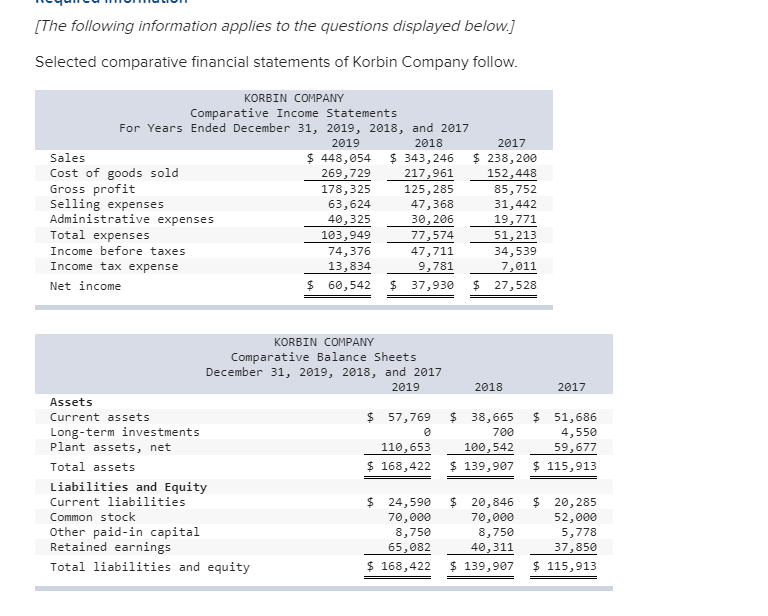
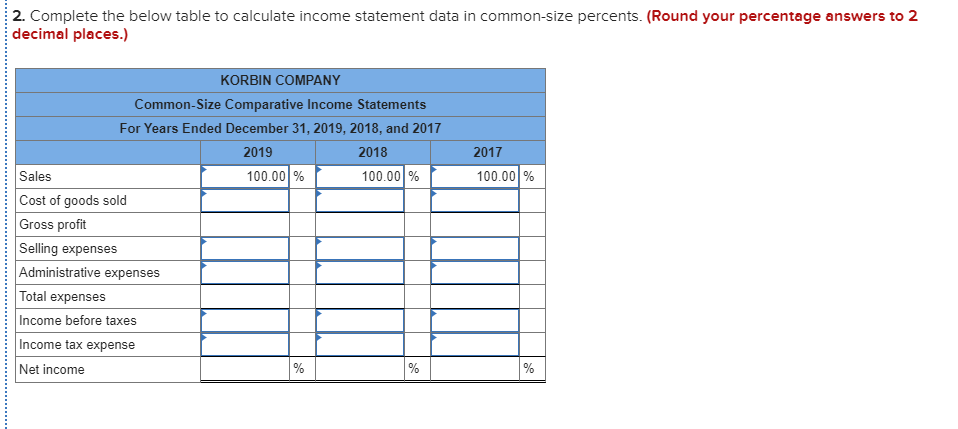
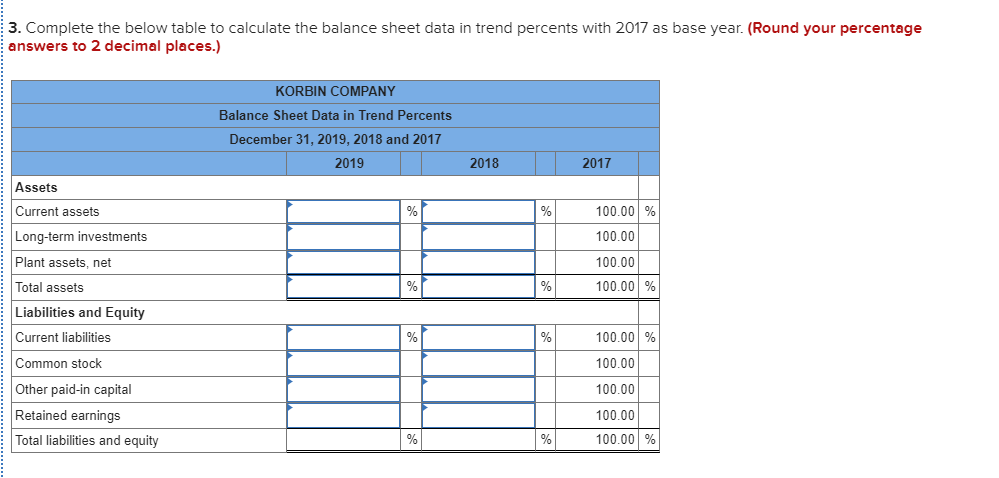
Selected comparative financial statements of Korbin Company follow. [The following information applies to the questions displayed below.) Selected comparative financial statements of Korbin Company follow.

Selected comparative financial statements of Korbin Company follow.

image text in transcribedimage text in transcribedimage text in transcribed

[The following information applies to the questions displayed below.) Selected comparative financial statements of Korbin Company follow. KORBIN COMPANY Comparative Income Statements For Years Ended December 31, 2019, 2018, and 2017 2019 2018 2017 Sales $ 448,054 $ 343, 246 $ 238,200 Cost of goods sold 269,729 217,961 152,448 Gross profit 178,325 125,285 85,752 Selling expenses 63,624 47,368 31,442 Administrative expenses 40,325 30,206 19,771 Total expenses 103,949 77,574 51,213 Income before taxes 74,376 47,711 34,539 Income tax expense 13,834 9,781 7,011 Net income $ 60,542 $ 37,930 $ 27,528 2018 2017 KORBIN COMPANY Comparative Balance Sheets December 31, 2019, 2018, and 2017 2019 Assets Current assets $ 57,769 Long-term investments 0 Plant assets, net 110,653 Total assets $ 168,422 Liabilities and Equity Current liabilities $ 24,590 Common stock 70,000 Other paid-in capital 8,750 Retained earnings 65,082 Total liabilities and equity $ 168,422 $ 38,665 700 100,542 $ 139,907 $ 51,686 4,550 59,677 $ 115,913 $ 20,846 70,000 8,750 40,311 $ 139,907 $ 20,285 52,000 5,778 _ 37,850 $ 115,913 2. Complete the below table to calculate income statement data in common-size percents. (Round your percentage answers to 2 decimal places.) 2017 100.00 % KORBIN COMPANY Common-Size Comparative Income Statements For Years Ended December 31, 2019, 2018, and 2017 2019 2018 Sales 100.00 % 100.00 % Cost of goods sold Gross profit Selling expenses Administrative expenses Total expenses Income before taxes Income tax expense Net income 3. Complete the below table to calculate the balance sheet data in trend percents with 2017 as base year. (Round your percentage answers to 2 decimal places.) KORBIN COMPANY Balance Sheet Data in Trend Percents December 31, 2019, 2018 and 2017 2019 2018 Assets Current assets 100.00 % 100.00 Long-term investments Plant assets, net Total assets Liabilities and Equity Current liabilities 100.00 100.00 % % % 100.00 % Common stock 100.00 100.00 Other paid-in capital Retained earnings Total liabilities and equity 100.00 100.00 %

Step by Step Solution

There are 3 Steps involved in it

Step: 1

blur-text-image

Get Instant Access to Expert-Tailored Solutions

See step-by-step solutions with expert insights and AI powered tools for academic success

Step: 2

blur-text-image

Step: 3

blur-text-image

Ace Your Homework with AI

Get the answers you need in no time with our AI-driven, step-by-step assistance

Get Started

Recommended Textbook for

Concept Audits A Philosophical Method

Authors: Nicholas Rescher

1st Edition

1498540392, 978-1498540391

More Books

Students also viewed these Accounting questions