

Question
SHOW ME THE ANSWER IN EXCEL OBJECTIVES: 1.make a pivot table and data visualization in Microsoft Excel. 2.Clearly organize and compute detailed information about the
SHOW ME THE ANSWER IN EXCEL
OBJECTIVES:
1.make a pivot table and data visualization in Microsoft Excel.
2.Clearly organize and compute detailed information about the three data sets.
3.Graph and calculate several descriptive measures of the data set using a variety of methods
Data Set 1:Categorical Data
The class levels of a simple random sample of students are as follow:
SeniorSeniorSeniorFreshmanJuniorSeniorSenior
SophomoreJuniorJuniorSeniorSeniorFreshmanSenior
SeniorSeniorSophomoreSophomoreSophomoreSophomoreSenior
Senior
Tasks:
a.Construct a table that gives the frequency distribution of this data. Interpret the result.
b.Construct a table that gives the relative frequency distribution of this data. Interpret the result.
c.Construct a pie chart of this data that displays the percentage of students at each class level. Interpret the result.
d.Construct a bar graph of this data that displays the frequency of students at each class level. Interpret the result.
Data Set 2:Discrete Data
A sample of clutch sizes (number of eggs produced) for a certain type of duck is given as follows:
13119811799106
10101210107101110
Tasks:
a.Construct a table that gives the frequency distribution of this data. Interpret the result.
b.Construct a table that gives the relative frequency distribution of this data. Interpret the result.
c.Construct a frequency histogram of this data. Interpret the result.
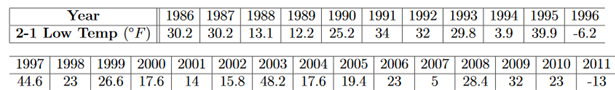
Data Set 3: Continuous Data
The low temperature on February 1st in Denver for the last 26 years is given by the table below.
Step by Step Solution
There are 3 Steps involved in it
Step: 1

Get Instant Access to Expert-Tailored Solutions
See step-by-step solutions with expert insights and AI powered tools for academic success
Step: 2

Step: 3
Ace Your Homework with AI
Get the answers you need in no time with our AI-driven, step-by-step assistance
Get Started
Finite Mathematics
Authors: Stefan Waner, Jerry Lee Ford Jr, Waner/Costenoble, Steven Costenoble
5th Edition
1111789304, 9781111789305