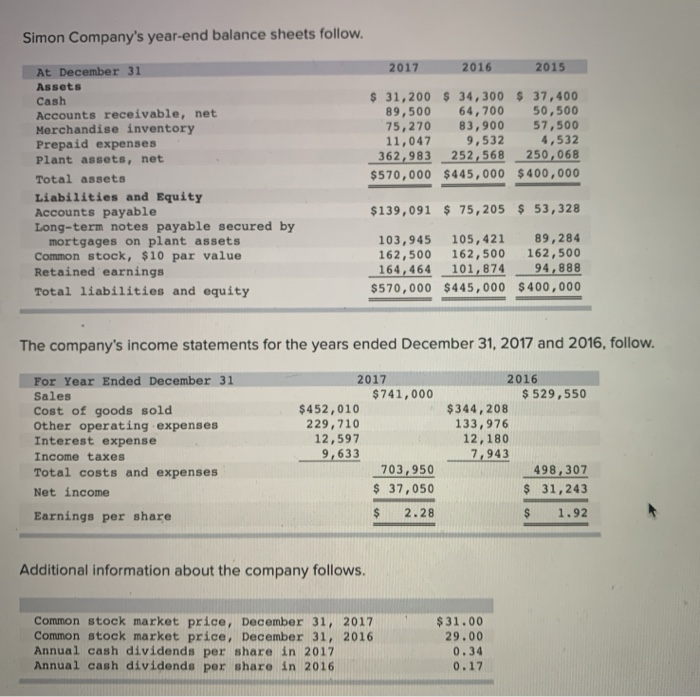
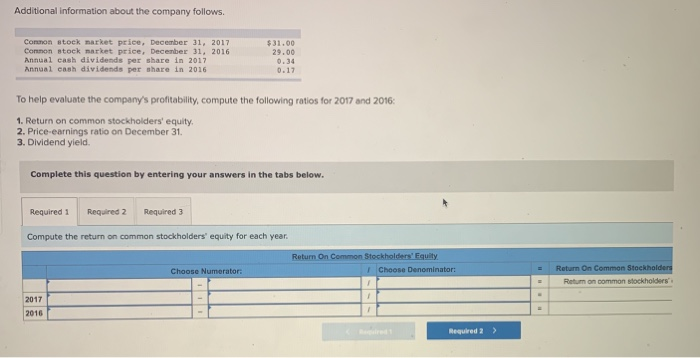
Simon Company's year-end balance sheets follow. 2017 2016 2015 At December 31 Assets Cash Accounts receivable, net Merchandise inventory Prepaid expenses Plant assets, net Total assets Liabilities and Equity Accounts payable Long-term notes payable secured by mortgages on plant assets Common stock, $10 par value Retained earnings Total liabilities and equity $ 31,200 $ 34,300 $ 37,400 89,500 64, 700 50,500 75,270 83,900 57,500 11,047 9,532 4,532 362,983 252,568 250,068 $570,000 $445,000 $400,000 $139,091 $ 75,205 $ 53,328 103,945 105,421 89,284 162,500 162,500 162,500 164,464 101,874 94,888 $570,000 $445,000 $400,000 The company's income statements for the years ended December 31, 2017 and 2016, follow. For Year Ended December 31 Sales Cost of goods sold Other operating expenses Interest expense Income taxes Total costs and expenses Net income Earnings per share 2017 $ 741,000 $452,010 229,710 12,597 9,633 703,950 $ 37,050 2016 $529,550 $344,208 133,976 12,180 7,943 498,307 $ 31,243 $ 2.28 $ 1.92 Additional information about the company follows. Common stock market price, December 31, 2017 Common stock market price, December 31, 2016 Annual cash dividends per share in 2017 Annual cash dividends por share in 2016 $31.00 29.00 0.34 0.17 Additional information about the company follows. Conmon stock market price, December 31, 2017 Connon stock market price, December 31, 2016 Annual cash dividends per share in 2017 Annual cash dividends per share in 2016 $31.00 29.00 0.34 0.17 To help evaluate the company's profitability, compute the following ratios for 2017 and 2016: 1. Return on common stockholders' equity 2. Price-earnings ratio on December 31. 3. Dividend yield Complete this question by entering your answers in the tabs below. Required 1 Required 2 Required 3 Compute the return on common stockholders' equity for each year. Return On Common Stockholders' Equity Choose Denominator: Choose Numerator: Return On Common Stockholders Retum on common stockholders' 2017 2016 Required 2 >