

Question
%% Simplified version of find the minimum of a function % Basically walk down the gradient from one side % Start at t = -10
%% Simplified version of find the minimum of a function
% Basically walk down the gradient from one side
% Start at t = -10 and keep adding deltaT = 1 to t until the next
% value is bigger
% At which point divide deltaT by 2 and continue...
% until deltaT is smaller than 0.001
clear
clc
clf
% A parabola
% STEP 1 - write the anonymous function from the lab here
% y = @(t) [fill in here]
% Plot it just to see what it looks like
fplot( y, [-10,10] );
hold on;
xlabel('t');
ylabel('y');
title('Find minimum');
%% Setting up before the while loop
% t to start at (save it for fprintf below)
tStart = -10.0;
% How much to keep incrementing t by
deltaT = 1;
% t will change in the while loop
t = tStart;
% Evaluate at t and t+deltaT
yPrev = y(t);
yNext = y(t + deltaT);
% Plot starting point
plot( t, yPrev, 'Xk');
%% The while loop structure
% you have to fill in the actual conditions (where it says CHANGE)
% and set t and deltaT
while false % CHANGE: this to be as long as deltaT is big enough
if true % CHANGE: Next step is BIGGER than previous
% plot in red
plot( t+deltaT, yNext, 'Xr');
% CHANGE: Cut the step size in half
%deltaT = ???
else
% Next step is SMALLER than previous - take one deltaT step
% plot in black
plot( t+deltaT, yNext, 'Xk');
% CHANGE: Take next step...
%t = ??
end
% Re-evaluate yPrev and yNext with the changed t or deltaT values
yPrev = y(t);
yNext = y(t + deltaT);
end
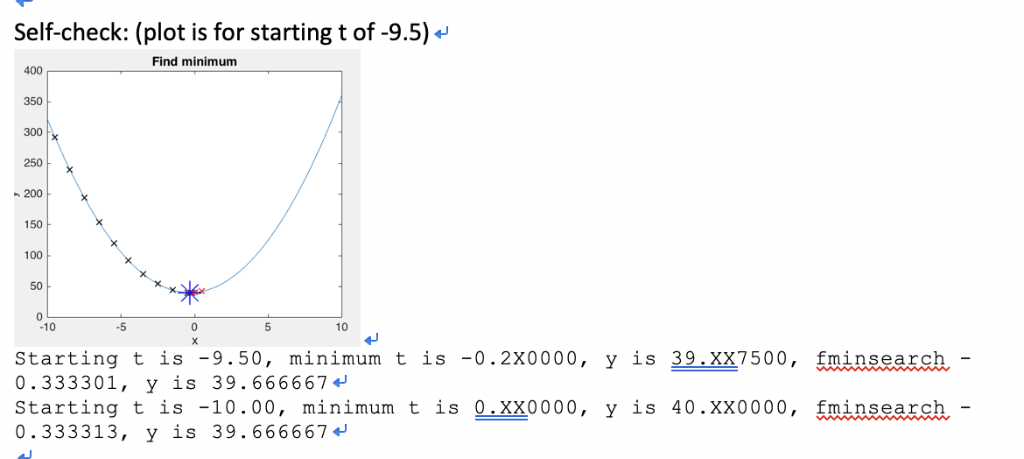
% The t and y you found
fprintf('Starting t is %0.2f, minimum t is %0.6f, y is %0.6f, ', tStart, t, y(t) );
% fminsearch does a much more sophisticated version of this, but basically
% the same idea - call here to see what *it* would return
tMin = fminsearch(y, t );
fprintf('fminsearch %0.6f, y is %0.6f ', tMin, y(tMin) );
% Add a blue * where the minimum actually is
plot( tMin, y(tMin), '*b', 'MarkerSize', 20);
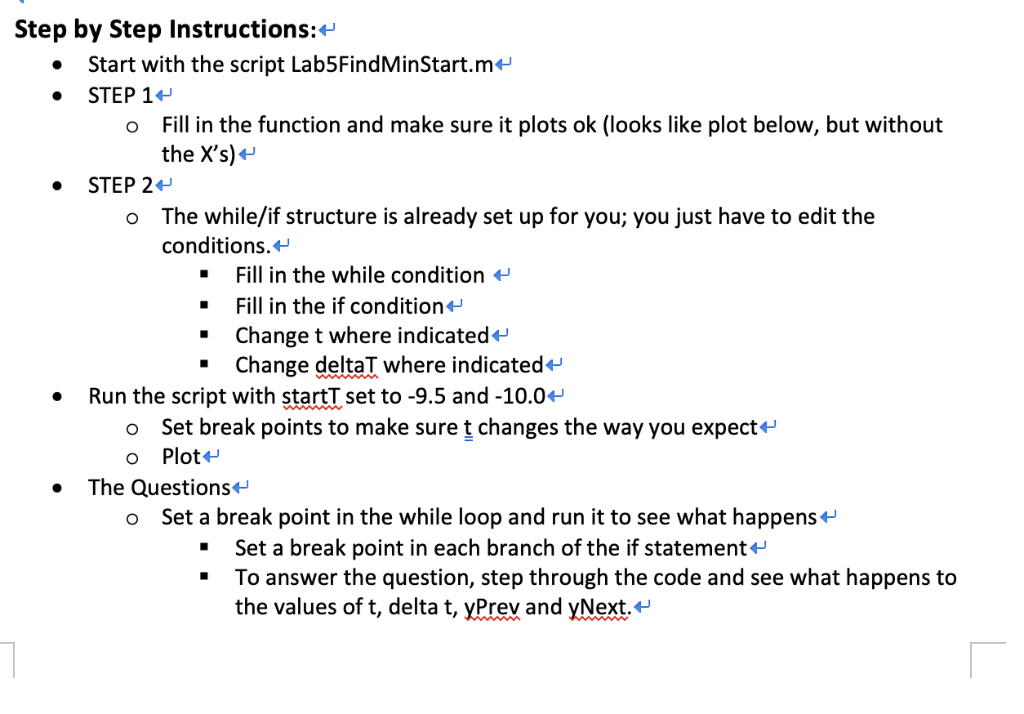
Step by Step Solution
There are 3 Steps involved in it
Step: 1

Get Instant Access to Expert-Tailored Solutions
See step-by-step solutions with expert insights and AI powered tools for academic success
Step: 2

Step: 3
Ace Your Homework with AI
Get the answers you need in no time with our AI-driven, step-by-step assistance
Get Started
Privacy In Statistical Databases Unesco Chair In Data Privacy International Conference Psd 2008 Istanbul Turkey September 2008 Proceedings Lncs 5262
Authors: Josep Domingo-Ferrer ,Yucel Saygin
2008th Edition
3540874704, 978-3540874706