Answered step by step
Verified Expert Solution
Link Copied!

Question

1 Approved Answer

SMGT3356 Business Strategic Assessment Assignment Questions: GAMMA RAY IS THE COMPANY X SO NEED TO ANALYZE THE COMPANY AND ITS STRATEGY IN BSG GAME. What

SMGT3356 Business Strategic Assessment

Assignment Questions:

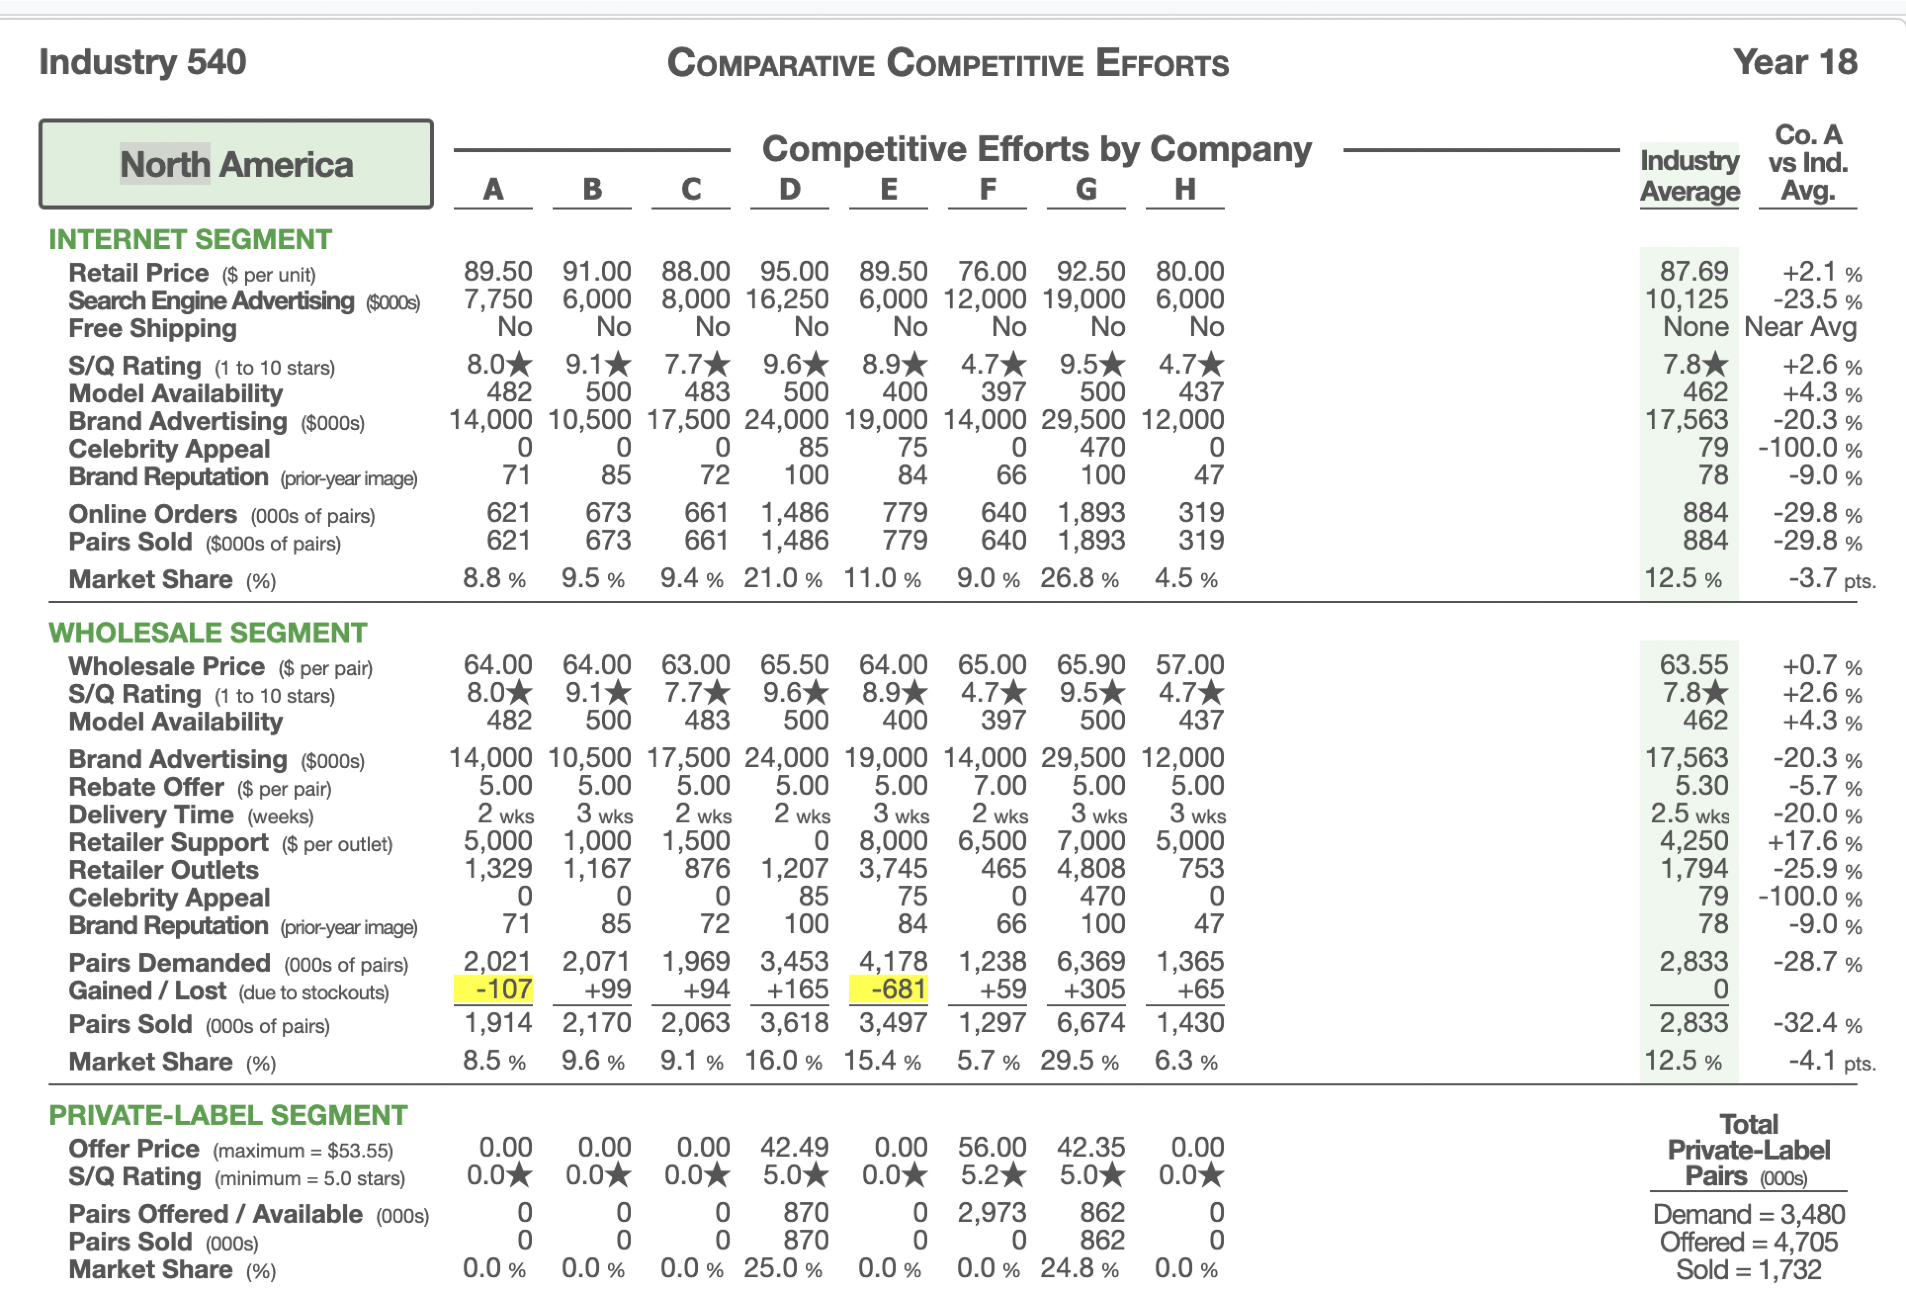
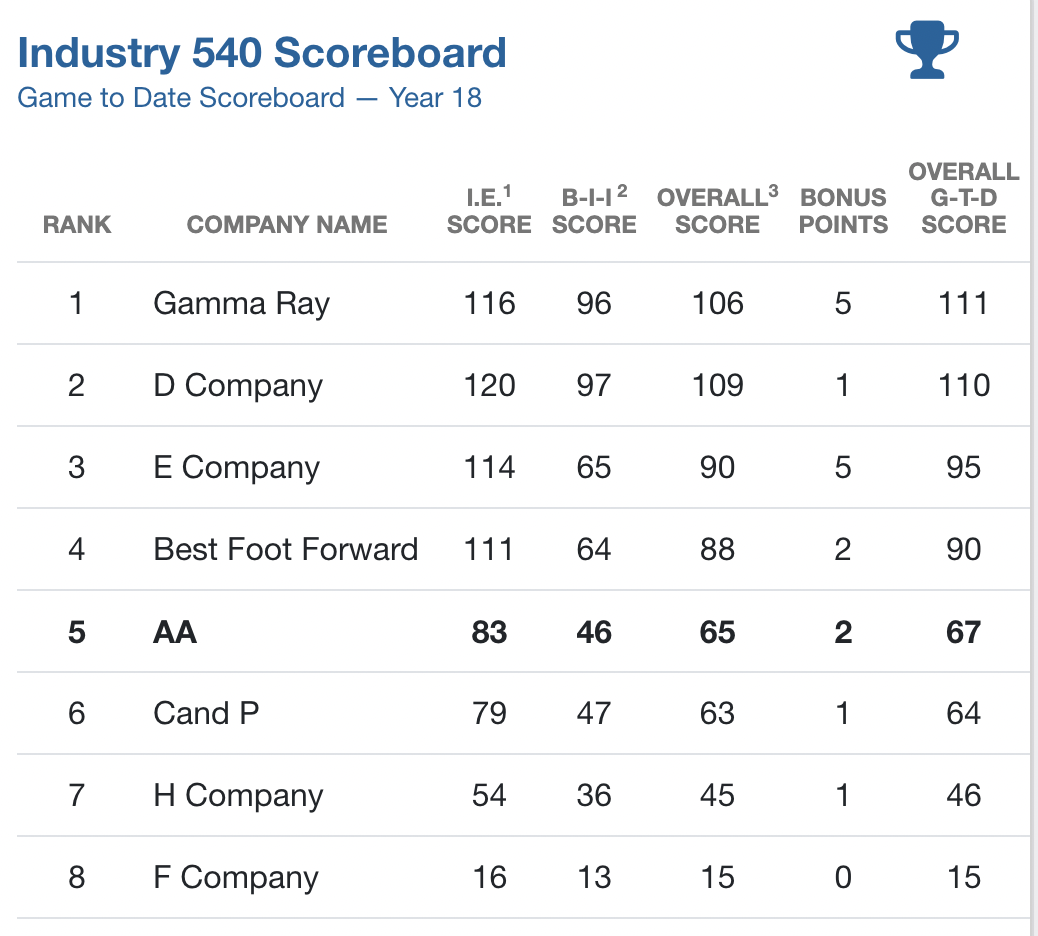
GAMMA RAY IS THE "COMPANY X" SO NEED TO ANALYZE THE COMPANY AND ITS STRATEGY IN BSG GAME.

  1. What is "Company X's" strategy? Which of the five generic competitive strategies discussed in Chapter 5 most closely fit the competitive approach that "Company X" is taking. What type of competitive advantage is "Company X" trying to achieve?
  2. What key factors will determine a company's success in the athletic footwear business in the next 3-5 years?
  3. What grade would you give to "Company X's" management for the job it has done in crafting the company's strategy? What is it that you like or dislike about the strategy? Does "Company X" have a winning strategy?
  4. What does a SWOT analysis of "Company X" reveal about the overall attractiveness of its situation?
  5. What is your appraisal of "Company X's" financial performance? How well is the company doing financially? Is there evidence that "Company X's" strategy is working?
  6. Does 'Company X" have adequate competitive strength to go head-to-head against its rivals? Do a weighted competitive strength assessment using the methodology presented in Table 4.4 on page 113 of Chapter 4 to support your answer. Has 'Company X" built a sustainable competitive advantage in the athletic business? Why or why not/
  7. What weaknesses or problems do you see that "Company X's" management needs to address?
  8. What recommendations would you make to "Company X" management to strengthen the company's competitive position and future strategic and financial performance?

"Company X" will be whoever won or is winning in your BSG Industry ('Game"). (You cannot analyze yourself. In this situation analyze the company that has come second.)

The BSA assignment is due after Year 19 or Year 20, when the BSG simulation has concluded, and on or before the Final Examination.

image text in transcribedimage text in transcribed
Industry 540 COMPARATIVE COMPETITIVE EFFORTS Year 18 Co. A North America Competitive Efforts by Company Industry vs Ind. A B C D E F G H Average Avg. INTERNET SEGMENT Retail Price ($ per unit) 89.50 91.00 88.00 95.00 89.50 76.00 92.50 80.00 87.69 +2.1 % Search Engine Advertising ($000s) 7,750 6,000 8,000 16,250 6,000 12,000 19,000 6,000 10,125 -23.5% Free Shipping No No No No No No No No None Near Avg S/Q Rating (1 to 10 stars) 8.0 9.1* 7.7* 9.6* 8.94 4.7* 9.5 4.7* 7.8A +2.6% Model Availability 482 500 483 500 400 397 500 437 462 +4.3% Brand Advertising ($000s) 14,000 10,500 17,500 24,000 19,000 14,000 29,500 12,000 17,563 -20.3 % Celebrity Appeal 0 85 75 O 470 0 79 -100.0% Brand Reputation (prior-year image) 71 85 72 100 84 66 100 47 78 -9.0% Online Orders (000s of pairs) 621 673 661 1,486 779 640 1,893 319 884 29.8% Pairs Sold ($000s of pairs) 621 673 661 1,486 779 640 1,893 319 884 -29.8% Market Share (%) 8.8% 9.5 % 9.4% 21.0% 11.0% 9.0 % 26.8% 4.5% 12.5% -3.7 pts. WHOLESALE SEGMENT Wholesale Price ($ per pair) 64.00 64.00 63.00 65.50 64.00 65.00 65.90 57.00 63.55 +0.7% S/Q Rating (1 to 10 stars) 8.0* 9.1* 7.7* 9.6* 8.9* 4.7* 9.5* 4.7* 7.8* +2.6% Model Availability 482 500 483 500 400 397 500 437 462 +4.3% Brand Advertising ($000s) 14,000 10,500 17,500 24,000 19,000 14,000 29,500 12,000 17,563 -20.3% Rebate Offer ($ per pair) 5.00 5.00 5.00 5.00 5.00 7.00 5.00 5.00 5.30 -5.7% Delivery Time (weeks) 2 wks 3 wks 2 wks 2 wks 3 wks 2 wks 3 wks 3 wks 2.5 wks -20.0 % Retailer Support ($ per outlet) 5,000 1,000 1,500 0 8,000 6,500 7,000 5,000 4,250 +17.6% Retailer Outlets 1,329 1, 167 876 1,207 3,745 465 4,808 753 1,794 -25.9 % Celebrity Appeal 0 0 0 85 75 0 470 0 79 -100.0% Brand Reputation (prior-year image) 71 85 72 100 84 66 100 47 78 -9.0% Pairs Demanded (000s of pairs) 2,021 2,071 1,969 3,453 4,178 1,238 6,369 1,365 2,833 -28.7% Gained / Lost (due to stockouts) -107 +99 +94 +165 -681 +59 +305 +65 0 Pairs Sold (000s of pairs) 1,914 2,170 2,063 3,618 3,497 1,297 6,674 1,430 2,833 -32.4% Market Share (%) 8.5 % 9.6% 9.1 % 16.0% 15.4% 5.7 % 29.5 % 6.3% 12.5% -4.1 pts. PRIVATE-LABEL SEGMENT Total Offer Price (maximum = $53.55) 0.00 0.00 0.00 42.49 0.00 56.00 42.35 0.00 Private-Label S/Q Rating (minimum = 5.0 stars) 0.0* 0.0* 0.0X 5.0* 0.0* 5.2* 5.0* 0.0* Pairs (000s) Pairs Offered / Available (000s) 0 870 0 2,973 862 Demand = 3,480 Pairs Sold (000s) 0 0 870 0 862 0 Offered = 4,705 Market Share (%) 0.0% 0.0% 0.0 % 25.0% 0.0% 0.0 % 24.8% 0.0% Sold = 1,732Industry 540 Scoreboard Game to Date Scoreboard - Year 18 OVERALL I.E.1 B-1-12 OVERALL3 BONUS G-T-D RANK COMPANY NAME SCORE SCORE SCORE POINTS SCORE 1 Gamma Ray 116 96 106 5 111 2 D Company 120 97 109 110 3 E Company 114 65 90 5 95 4 Best Foot Forward 111 64 88 2 90 5 AA 83 46 65 2 67 6 Cand P 79 47 63 64 7 H Company 54 36 45 46 8 F Company 16 13 15 0 15

Step by Step Solution

There are 3 Steps involved in it

Step: 1

blur-text-image

Get Instant Access to Expert-Tailored Solutions

See step-by-step solutions with expert insights and AI powered tools for academic success

Step: 2

blur-text-image

Step: 3

blur-text-image

Ace Your Homework with AI

Get the answers you need in no time with our AI-driven, step-by-step assistance

Get Started

Recommended Textbook for

Transport Operations

Authors: Allen Stuart

2nd Edition

978-0470115398, 0470115394

More Books

Students also viewed these General Management questions