Answered step by step
Verified Expert Solution
Link Copied!

Question

1 Approved Answer

Solve all!!! A statistics teacher wanted to compare two methods of teaching introductory statistics. One method relied heavily on teaching the theory behind statistics (the

Solve all!!!

A statistics teacher wanted to compare two methods of teaching introductory statistics. One method relied heavily on teaching the theory behind statistics (the theory method). The other method consisted of teaching the students various statistical tests and explaining when to use each test (the cookbook method). The teacher found that a leading engineering school was using the theory method in all its introductory statistics classes and that a local teacher's college was using the cookbook method in all its introductory statistics classes. At the end of each semester the teacher administered a standardized statistics test to both sets of classes.

What are the levels of the independent variable in this study?

What is a control variable used in this study?

What is type of experimental design is being used here?

The results indicated that the classes that received the theory method performed far better than did the classes that received the cookbook method. Can the teacher conclude that the theory method was the superior method and that is should be adopted by all statistics teachers? Explain why or why not.

How would you design a study to determine which teaching method for statistics is more effective so that it does not have a confounding variable?

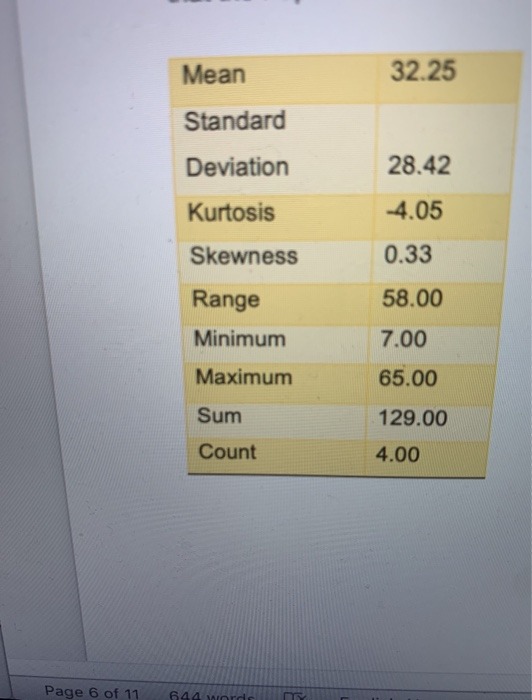
image text in transcribedimage text in transcribedimage text in transcribedimage text in transcribed
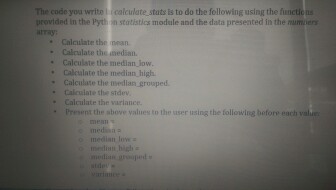
Question 1 (10 marks) Select a newspaper/magazine/Internet article published in 2019-present related to Imperfect Competition or Ayammetric Information or Macroeconomic Statistics. Alternatively, you can submit one simple data analysis related to Imperfect Competition or Aysmmetric Information or Macroeconomic Statistics. Use relevant economic concepts and theories to analysis your selected article or the findings from your simple data analysis.Mean 32.25 Standard Deviation 28.42 Kurtosis -4.05 Skewness 0.33 Range 58.00 Minimum 7.00 Maximum 65.00 Sum 129.00 Count 4.00 Page 6 of 11The code you write I icalculate state is to do the following using the functions provided in the Python statistics module and the data presented in the Rumer Calculate the mean Calculate the median. Calculate the median low. Calculate the median high Calculate the mellan grouped Calculate the virlance. Present the shove valuey in the user using the following before each value memIT medina median IniExcel Online Structured Activity: ROE and ROIC Baker Industries' net income is $27090, its interest expense is $6000, and its tax rate is 40%%. Its notes payable equals $26000, long-term debt equals $80000, and common equity equal $240800. The firm finances with only debt and common equity, so it has no preferred stock, The data has been colleded in the Microsoft Excel Online file below. Open the spreadsheet and perform the required analysis to answer the questions below. X Open spreadsheet What are the firm's ROE and ROICT Round your answers to two decimal places. Do not round moringed to 11.25(5) ROTC

Step by Step Solution

There are 3 Steps involved in it

Step: 1

blur-text-image

Get Instant Access to Expert-Tailored Solutions

See step-by-step solutions with expert insights and AI powered tools for academic success

Step: 2

blur-text-image

Step: 3

blur-text-image

Ace Your Homework with AI

Get the answers you need in no time with our AI-driven, step-by-step assistance

Get Started

Recommended Textbook for

Algebra And Trigonometry, Enhanced

Authors: Cynthia Y Young

4th Edition

1119320860, 9781119320869

More Books

Students also viewed these Mathematics questions