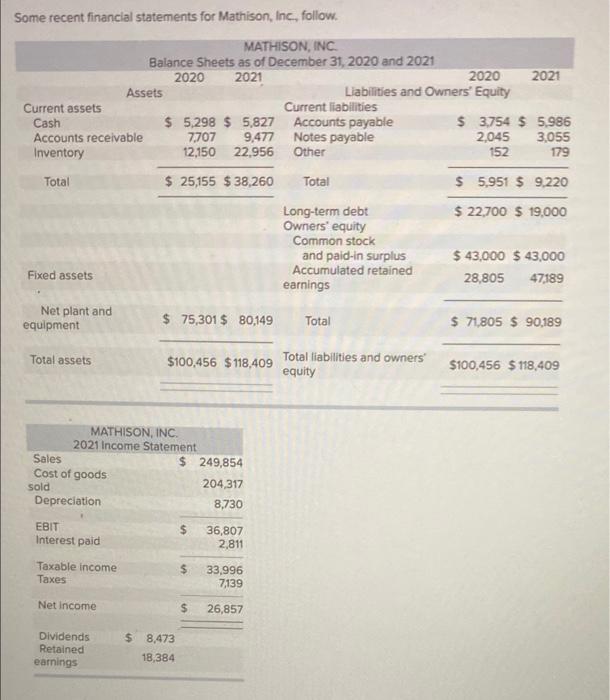
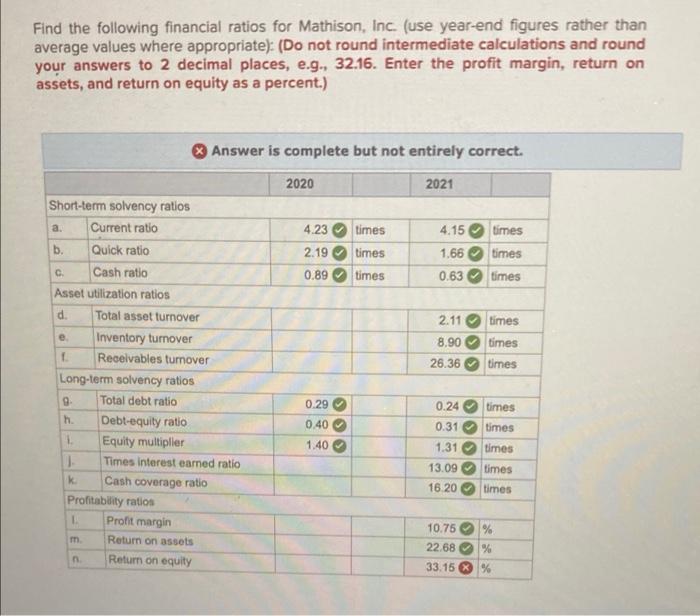
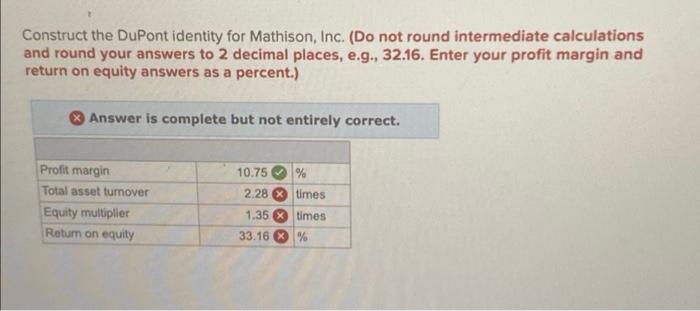
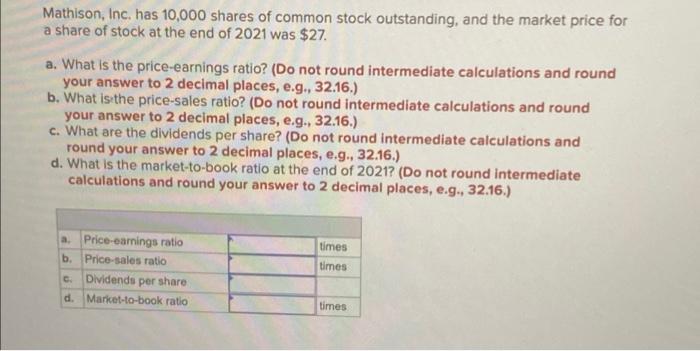
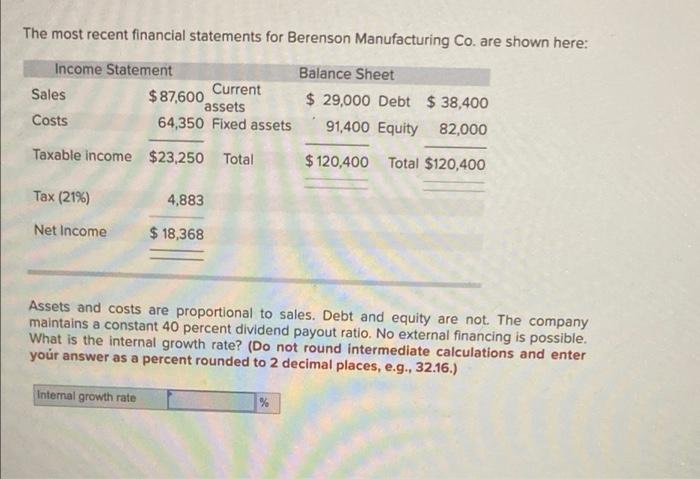
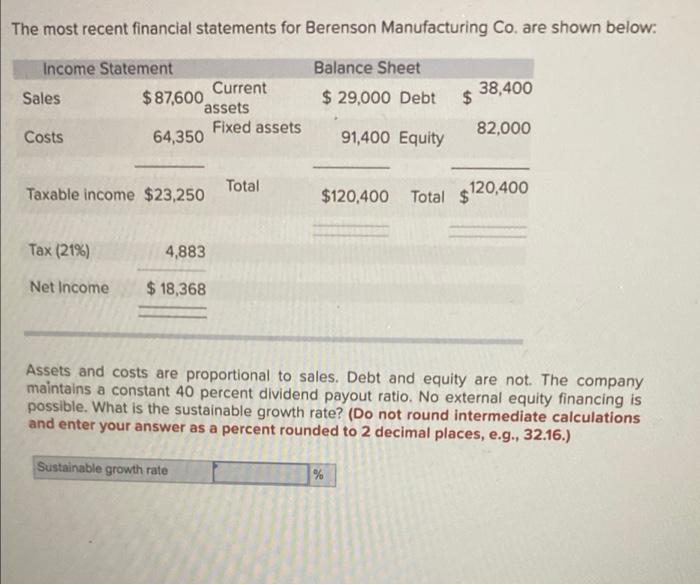
Some recent financial statements for Mathison, Inc., follow. MATHISON, INC. Balance Sheets as of December 31, 2020 and 2021 2020 2021 Current assets Cash Accounts receivable Inventory Total Fixed assets Net plant and equipment Total assets Sales Cost of goods sold Depreciation EBIT Interest paid Taxable income Taxes MATHISON, INC. 2021 Income Statement Net Income Assets Dividends Retained earnings $5,298 $ 5,827 7,707 12,150 22,956 9,477 $ 25,155 $38,260 $ 75,301 $ 80,149 $100,456 $118,409 $ 8,473 18,384 $ 249,854 204,317 8,730 $ 36,807 2,811 33,996 7,139 26,857 Current liabilities Accounts payable Notes payable Other Total Liabilities and Owners' Equity Long-term debt Owners' equity Common stock and paid-in surplus Accumulated retained earnings Total 2020 2021 Total liabilities and owners equity $ 3,754 $ 5,986 2,045 3,055 152 179 $ 5,951 $ 9,220 $ 22,700 $ 19,000 $43,000 $43,000 28,805 47,189 $71,805 $ 90,189 $100,456 $118,409 Find the following financial ratios for Mathison, Inc. (use year-end figures rather than average values where appropriate): (Do not round intermediate calculations and round your answers to 2 decimal places, e.g., 32.16. Enter the profit margin, return on assets, and return on equity as a percent.) Short-term solvency ratios Current ratio b. Quick ratio C. Cash ratio Asset utilization ratios d. a. e L 9. Long-term solvency ratios Total debt ratio Debt-equity ratio Equity multiplier Times interest earned ratio Cash coverage ratio h. L 1. k Total asset turnover Inventory turnover Receivables turnover Profitability ratios L m. n. Answer is complete but not entirely correct. Profit margin Return on assets Return on equity 2020 4.23 times 2.19 times 0.89 times 0.29 0.40 1.40 > 2021 4.15 1.66 0.63 2.11 8.90 26.36 times times times 10.75 22.68 33.15 times times times 0.24 times 0.31 times 1.31 times 13.09 times 16.20 times % % % Construct the DuPont identity for Mathison, Inc. (Do not round intermediate calculations and round your answers to 2 decimal places, e.g., 32.16. Enter your profit margin and return on equity answers as a percent.) Answer is complete but not entirely correct. Profit margin Total asset turnover Equity multiplier Return on equity 10.75 % 2.28 x times 1.35 x times 33.16% Mathison, Inc. has 10,000 shares of common stock outstanding, and the market price for a share of stock at the end of 2021 was $27. a. What is the price-earnings ratio? (Do not round intermediate calculations and round your answer to 2 decimal places, e.g., 32.16.) b. What is the price-sales ratio? (Do not round intermediate calculations and round your answer to 2 decimal places, e.g., 32.16.) c. What are the dividends per share? (Do not round intermediate calculations and round your answer to 2 decimal places, e.g., 32.16.) d. What is the market-to-book ratio at the end of 2021? (Do not round intermediate calculations and round your answer to 2 decimal places, e.g., 32.16.) a. Price-earnings ratio b. Price-sales ratio c. Dividends per share d. Market-to-book ratio times times times The most recent financial statements for Berenson Manufacturing Co. are shown here: Balance Sheet $ 29,000 Debt $ 38,400 91,400 Equity 82,000 $120,400 Total $120,400 Income Statement Sales Costs Taxable income $23,250 Total Tax (21%) Net Income $87,600 Current assets 64,350 Fixed assets Internal growth rate 4,883 $18,368 Assets and costs are proportional to sales. Debt and equity are not. The company maintains a constant 40 percent dividend payout ratio. No external financing is possible. What is the internal growth rate? (Do not round intermediate calculations and enter your answer as a percent rounded to 2 decimal places, e.g., 32.16.) The most recent financial statements for Berenson Manufacturing Co. are shown below: Income Statement Balance Sheet $ 29,000 Debt 91,400 Equity Sales Costs Tax (21%) $87,600 64,350 Taxable income $23,250 Net Income assets Fixed assets 4,883 $18,368 Current Sustainable growth rate Total $ 38,400 82,000 $120,400 Total $120,400 Assets and costs are proportional to sales. Debt and equity are not. The company maintains a constant 40 percent dividend payout ratio. No external equity financing is possible. What is the sustainable growth rate? (Do not round intermediate calculations and enter your answer as a percent rounded to 2 decimal places, e.g., 32.16.) %
