statistician wishes with R
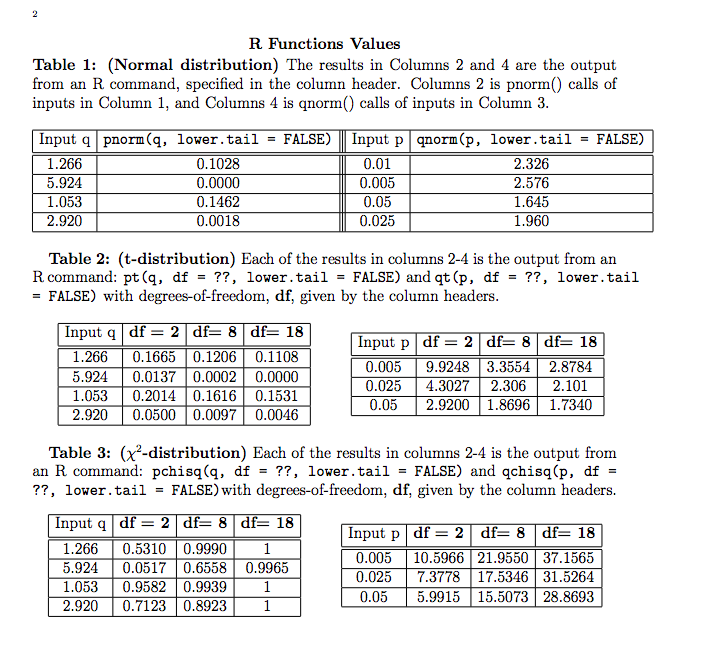
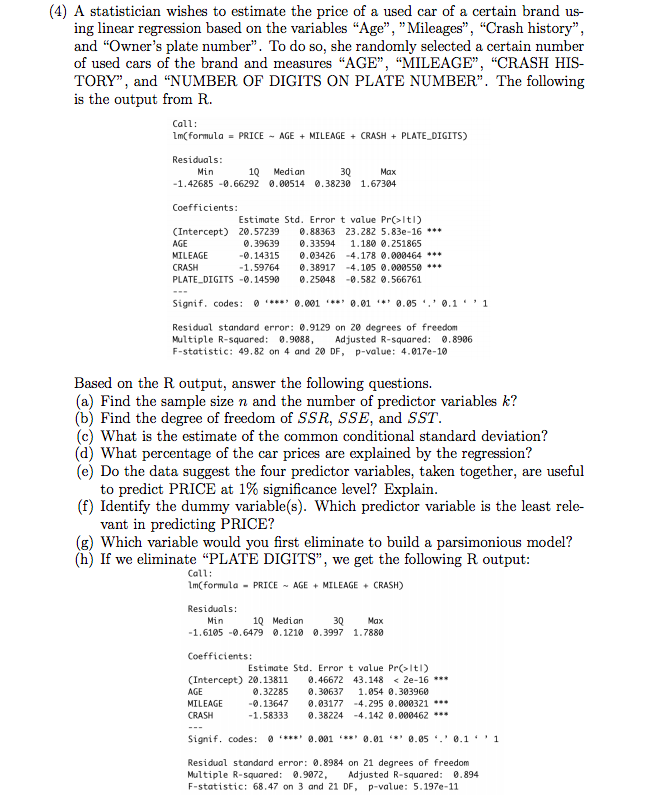
R Functions Values Table 1: (Normal distribution) The results in Columns 2 and 4 are the output from an R command, specified in the column header. Columns 2 is pnorm() calls of inputs in Column 1, and Columns 4 is qnorm() calls of inputs in Column 3. Input q pnorm (q, lower . tail = FALSE) Input p qnorm(p, lower . tail = FALSE) 1.266 0.1028 0.01 2.326 5.924 0.0000 0.005 2.576 1.053 0.1462 0.05 1.645 2.920 0.0018 0.025 1.960 Table 2: (t-distribution) Each of the results in columns 2-4 is the output from an R command: pt (q, df = ??, lower. tail = FALSE) and qt (p, df = ??, lower. tail = FALSE) with degrees-of-freedom, df, given by the column headers. Input q df = 2 df= 8 df= 18 Input p df = 2 df= 8 df= 18 1.266 0.1665 0.1206 0.1108 5.924 0.0137 0.0002 0.0000 0.005 9.9248 3.3554 2.8784 1.053 0.2014 0.1616 0.1531 0.025 4.3027 2.306 2.101 2.920 0.0500 0.0097 0.0046 0.05 2.9200 1.8696 1.7340 Table 3: (x'-distribution) Each of the results in columns 2-4 is the output from an R command: pchisq(q, df = ??, lower. tail = FALSE) and qchisq(p, df = ??, lower. tail = FALSE) with degrees-of-freedom, df, given by the column headers. Input q df = 2 df= 8 df= 18 1.266 Input p df = 2 df= 8 df= 18 0.5310 0.9990 1 5.924 0.0517 0.6558 0.9965 0.005 10.5966 21.9550 37.1565 1.053 0.9582 0.9939 0.025 7.3778 17.5346 31.5264 2.920 0.7123 0.8923 1 0.05 5.9915 15.5073 28.8693(4) A statistician wishes to estimate the price of a used car of a certain brand us- ing linear regression based on the variables "Age", "Mileages", "Crash history", and "Owner's plate number". To do so, she randomly selected a certain number of used cars of the brand and measures "AGE", "MILEAGE", "CRASH HIS- TORY", and "NUMBER OF DIGITS ON PLATE NUMBER". The following is the output from R. Call: Im(formula = PRICE - AGE + MILEAGE + CRASH + PLATE_DIGITS) Residuals: Min Median 30 Max -1. 42685 -0.66292 0.00514 0.38230 1.67304 Coefficients: Estimate Std. Error t value Pr(>Itl) (Intercept) 20.57239 0. 88363 23.282 5.83e-16 *++ AGE 0.39639 3.33594 1. 180 0.251865 MILEAGE -0. 14315 3. 03426 -4.178 0. 090464 .*+ CRASH -1.59764 3.38917 -4. 105 0.090550 *+ + PLATE_DIGITS -Q. 14590 9. 25048 -0.582 0.566761 Signif. codes: 0 ' 0.001 9 0.01 0.05 ", ' 0.1 ' ' 1 Residual standard error: 0.9129 on 20 degrees of freedom Multiple R-squared: 0.9088, Adjusted R-squared: 0.8906 F-statistic: 49.82 on 4 and 20 DF, p-value: 4.017e-10 Based on the R output, answer the following questions. (a) Find the sample size n and the number of predictor variables k? (b) Find the degree of freedom of SSR, SSE, and SST. (c) What is the estimate of the common conditional standard deviation? (d) What percentage of the car prices are explained by the regression? (e) Do the data suggest the four predictor variables, taken together, are useful to predict PRICE at 1% significance level? Explain. (f) Identify the dummy variable(s). Which predictor variable is the least rele- vant in predicting PRICE? (g) Which variable would you first eliminate to build a parsimonious model? (h) If we eliminate "PLATE DIGITS", we get the following R output: Call: 1m(formula - PRICE ~ AGE + MILEAGE + CRASH) Residuals: Min 10 Median 3Q Max -1. 6105 -0.6479 0. 1210 0.3997 1.7880 Coefficients: Estimate Std. Error t value Pr(>Itl) (Intercept) 20.13811 0. 46672 43.148