Answered step by step
Verified Expert Solution
Link Copied!

Question

1 Approved Answer

Statistics and probalbility (h) The energy commission directed an oicer to report the proportion of the type of electric users in Malaysia. The ofce prepared

Statistics and probalbility
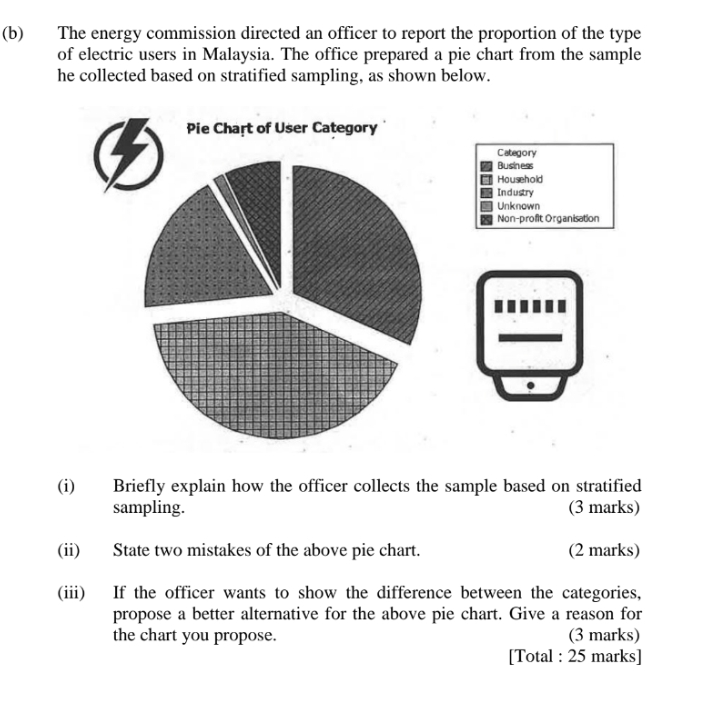
image text in transcribed
(h) The energy commission directed an oicer to report the proportion of the type of electric users in Malaysia. The ofce prepared a pie chart from the sample he collected based on stratied sampling. as shown below. {i} Briefly explain how the ofcer collects the sample based on stratied sampling. (3 marks} (ii) State two mistakes of the above pie chart. (2 marks} (iii) If the officer wants to show the difference between the categories. propose a better altemative for the above pie chart. Give a reason for the chart you propose. (3 marks} [Total : 25 marks]

Step by Step Solution

There are 3 Steps involved in it

Step: 1

blur-text-image

Get Instant Access to Expert-Tailored Solutions

See step-by-step solutions with expert insights and AI powered tools for academic success

Step: 2

blur-text-image

Step: 3

blur-text-image

Ace Your Homework with AI

Get the answers you need in no time with our AI-driven, step-by-step assistance

Get Started

Recommended Textbook for

A Short Course In Automorphic Functions

Authors: Joseph Lehner

1st Edition

0486799921, 9780486799926

More Books

Students also viewed these Mathematics questions