Answered step by step
Verified Expert Solution
Question
1 Approved Answer
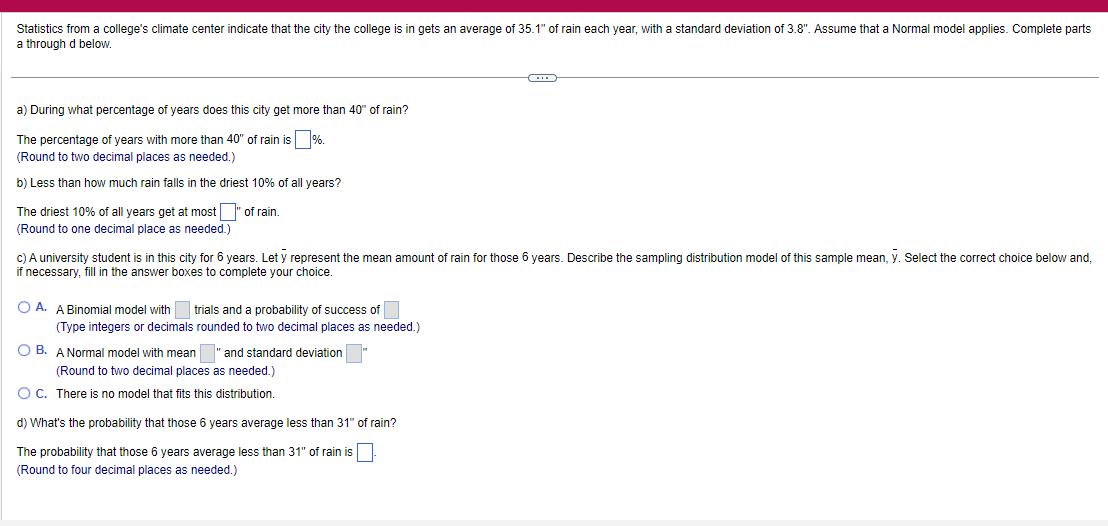
Statistics from a college's climate center indicate that the city the college is in gets an average of 35.1 of rain each year, with

Statistics from a college's climate center indicate that the city the college is in gets an average of 35.1" of rain each year, with a standard deviation of 3.8". Assume that a Normal model applies. Complete parts a through d below. a) During what percentage of years does this city get more than 40" of rain? The percentage of years with more than 40" of rain is %. (Round to two decimal places as needed.) b) Less than how much rain falls in the driest 10% of all years? The driest 10% of all years get at most of rain. (Round to one decimal place as needed.) c) A university student is in this city for 6 years. Let y represent the mean amount of rain for those 6 years. Describe the sampling distribution model of this sample mean, y. Select the correct choice below and, if necessary, fill in the answer boxes to complete your choice. OA. A Binomial model with trials and a probability of success of (Type integers or decimals rounded to two decimal places as needed.) OB. A Normal model with mean and standard deviation. (Round to two decimal places as needed.) OC. There is no model that fits this distribution. d) What's the probability that those 6 years average less than 31" of rain? The probability that those 6 years average less than 31" of rain is (Round to four decimal places as needed.)
Step by Step Solution
★★★★★
3.46 Rating (156 Votes )
There are 3 Steps involved in it
Step: 1
The image presents a set of statistics problems based on the assumption that rain data in a city follows a normal distribution with a mean annual rain...
Get Instant Access to Expert-Tailored Solutions
See step-by-step solutions with expert insights and AI powered tools for academic success
Step: 2

Step: 3

Ace Your Homework with AI
Get the answers you need in no time with our AI-driven, step-by-step assistance
Get Started


