Question
Superior Medical Equipment Company supplies electrical equipment that is used as components in the assembly of MRI, CAT scanners, PET scanners, and other medical diagnostic
Superior Medical Equipment Company supplies electrical equipment that is used as components in the assembly of MRI, CAT scanners, PET scanners, and other medical diagnostic equipment. Superior has production facilities in Phoenix, Arizona, and Monterrey, Mexico. Customers for the components are located in selected locations throughout the United States and Canada. Currently, a warehouse, that receives all components from the plants and redistributes them to customers, is located in Kansas City, KS. Figure 1 shows the geographical placement of these facilities.
Superiors management is concerned about the location of its warehouse since its sales have declined due to increasing competition and shifting sales levels among its customers. The lease is about to expire on the current warehouse, and management wishes to examine whether it should bbe renewed or warehouse space at some other location should be leased. The warehouse owner has offered to renew the lease at an attractive rate of $2.75 per sq ft per year for the 200,000 sq ft facility. It is estimated that any other location would cost $3.25 per sq ft for a similar size warehouse. A new of renewed lease will be for five years. Moving the inventory, moving expenses for key personnel, and other location expenses would result in a one-time charge of $300,000. Warehouse operating costs are expected to be similar at any location.
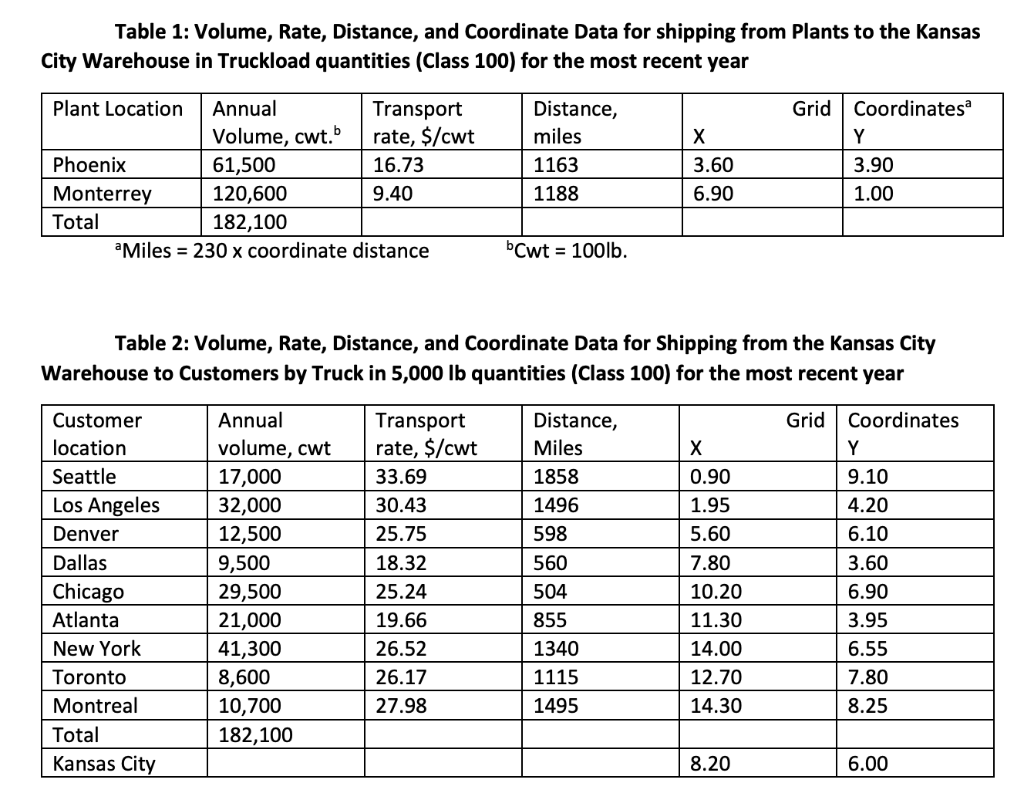
In the most recent year, Superior was able to achieve sales of nearly $70M. Transportation costs from the plants to Kansas warehouse were $2,162,535, and from the warehouse to the customers were $4,819,569. One million dollars was paid annually as warehouse lease expenses. To study the warehouse location question, the data shown in Tables 1 and 2 were collected. Although transport costs are not usually expressed as $/cwt/mile basis, given that the outbound transportation costs for the most recent year were $4,819,569, the weighted average distance of the shipments was 1128 miles, and the annual volume shipped was 182,100 cwt, the estimated average outbound rate from a warehouse would be $0.0235/cwt/mile.

QUESTIONS
1. Based on information for the current year, is Kansas City the best location for a warehouse? If not, what are the coordinates for a better location? What cost improvement can be expected from the new location?
2. In five years, management expects the Seattle, Los Angeles, and Denver markets to grow by 5%, but the remaining markets to decline by 10%. Transport costs are expected to be unchanged. Phoenix output will increase by 5%, and Monterrers output will decrease by 10%. Under these new conditions, would your decision about the warehouse location change? If so, how?
3. If by year 5 increases are expected of 25% in warehouse outbound transport rates and 15% in warehouse inbound rates, would your decision change about the warehouse location?
4. If the center of gravity method is used to analyze the data, what are its benefits and limitations for locating a warehouse?
Table 1: Volume, Rate, Distance, and coordinate Data for shipping from Plants to the Kansas City Warehouse in Truckload quantities (Class 100) for the most recent year Grid Plant Location Annual Transport Volume, cwt. rate, $/cwt Phoenix 61,500 16.73 Monterrey 120,600 9.40 Total 182,100 Miles = 230 x coordinate distance Distance, miles 1163 1188 3.60 6.90 Coordinatesa Y 3.90 1.00 bCwt = 100lb. Table 2: Volume, Rate, Distance, and coordinate Data for Shipping from the Kansas City Warehouse to Customers by Truck in 5,000 lb quantities (Class 100) for the most recent year Grid Coordinates Y 9.10 4.20 Customer location Seattle Los Angeles Denver Dallas Chicago Atlanta New York Toronto Montreal Total Kansas City Annual volume, cut 17,000 32,000 12,500 9,500 29,500 21,000 41,300 8,600 10,700 182,100 Transport rate, $/cwt 33.69 30.43 25.75 18.32 25.24 19.66 26.52 26.17 27.98 Distance, Miles 1858 1496 598 560 504 855 1340 1115 1495 X 0.90 1.95 5.60 7.80 10.20 11.30 14.00 12.70 14.30 6.10 3.60 6.90 3.95 6.55 7.80 8.25 8.20 6.00 Table 1: Volume, Rate, Distance, and coordinate Data for shipping from Plants to the Kansas City Warehouse in Truckload quantities (Class 100) for the most recent year Grid Plant Location Annual Transport Volume, cwt. rate, $/cwt Phoenix 61,500 16.73 Monterrey 120,600 9.40 Total 182,100 Miles = 230 x coordinate distance Distance, miles 1163 1188 3.60 6.90 Coordinatesa Y 3.90 1.00 bCwt = 100lb. Table 2: Volume, Rate, Distance, and coordinate Data for Shipping from the Kansas City Warehouse to Customers by Truck in 5,000 lb quantities (Class 100) for the most recent year Grid Coordinates Y 9.10 4.20 Customer location Seattle Los Angeles Denver Dallas Chicago Atlanta New York Toronto Montreal Total Kansas City Annual volume, cut 17,000 32,000 12,500 9,500 29,500 21,000 41,300 8,600 10,700 182,100 Transport rate, $/cwt 33.69 30.43 25.75 18.32 25.24 19.66 26.52 26.17 27.98 Distance, Miles 1858 1496 598 560 504 855 1340 1115 1495 X 0.90 1.95 5.60 7.80 10.20 11.30 14.00 12.70 14.30 6.10 3.60 6.90 3.95 6.55 7.80 8.25 8.20 6.00Step by Step Solution
There are 3 Steps involved in it
Step: 1

Get Instant Access to Expert-Tailored Solutions
See step-by-step solutions with expert insights and AI powered tools for academic success
Step: 2

Step: 3

Ace Your Homework with AI
Get the answers you need in no time with our AI-driven, step-by-step assistance
Get Started


