Answered step by step
Verified Expert Solution
Link Copied!

Question

1 Approved Answer

Suppose an individual has an income of $200 per time period, the price of good X is $2 and the price of good Y is
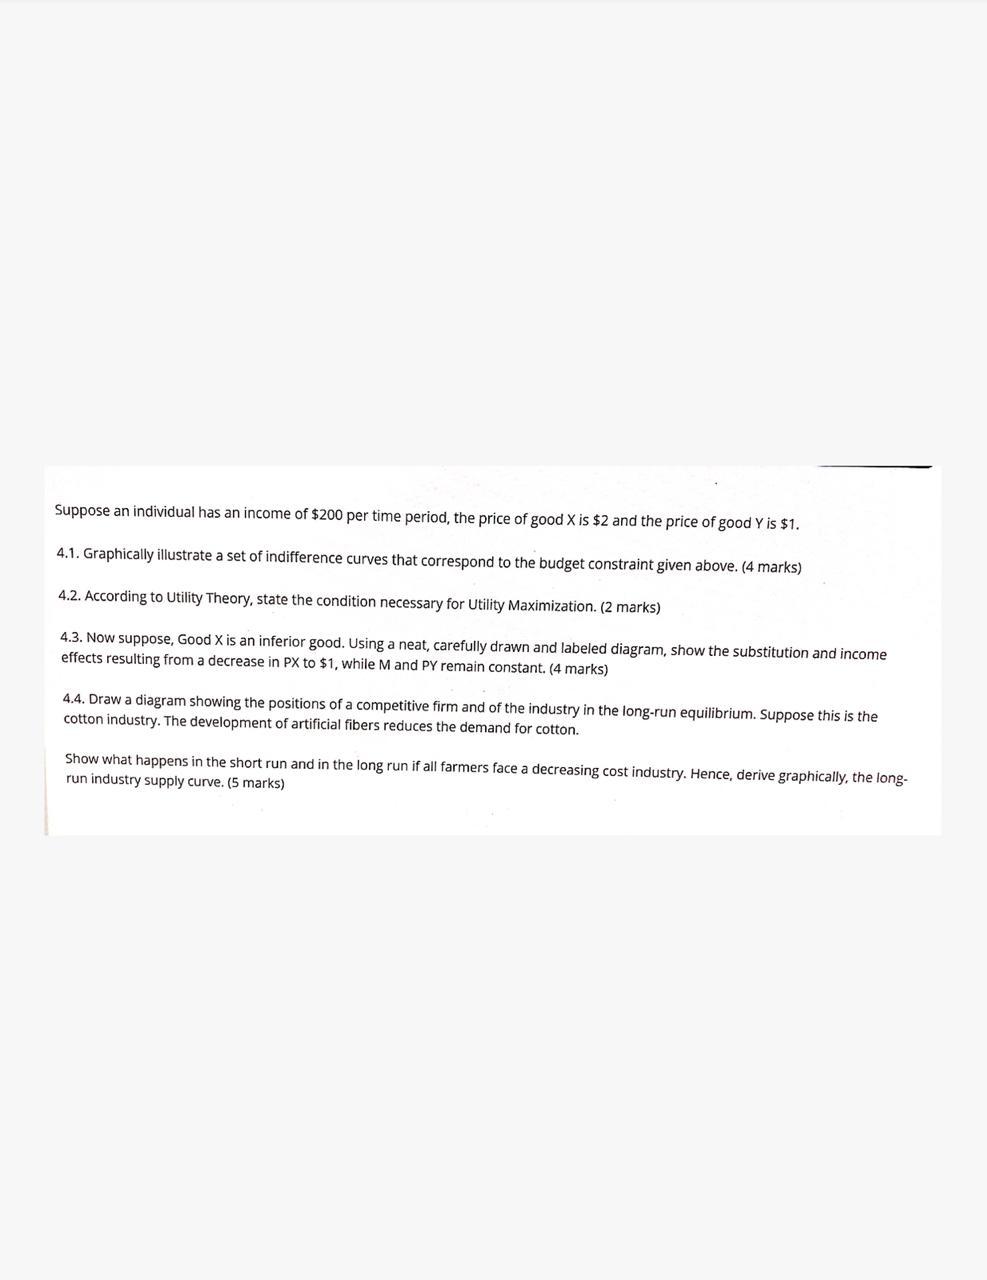
image text in transcribed

Suppose an individual has an income of $200 per time period, the price of good X is $2 and the price of good Y is $1. 4.1. Graphically illustrate a set of indifference curves that correspond to the budget constraint given above. (4 marks) 4.2. According to Utility Theory, state the condition necessary for Utility Maximization. (2 marks) 4.3. Now suppose, Good X is an inferior good. Using a neat, carefully drawn and labeled diagram, show the substitution and income effects resulting from a decrease in PX to $1, while M and PY remain constant. (4 marks) 4.4. Draw a diagram showing the positions of a competitive firm and of the industry in the long-run equilibrium. Suppose this is the cotton industry. The development of artificial fibers reduces the demand for cotton. Show what happens in the short run and in the long run if all farmers face a decreasing cost industry. Hence, derive graphically, the long- run industry supply curve

Step by Step Solution

There are 3 Steps involved in it

Step: 1

blur-text-image

Get Instant Access to Expert-Tailored Solutions

See step-by-step solutions with expert insights and AI powered tools for academic success

Step: 2

blur-text-image

Step: 3

blur-text-image

Ace Your Homework with AI

Get the answers you need in no time with our AI-driven, step-by-step assistance

Get Started

Recommended Textbook for

Principles Of Econometrics

Authors: R Hill

4th Edition

1118136969, 9781118136966

More Books

Students also viewed these Economics questions

Question

Explain Business Continuity/Disaster Recovery Plan Developement.

Answered: 1 week ago