Answered step by step
Verified Expert Solution
Question
1 Approved Answer
Suppose monthly starting salaries for new college graduates in economics follow a normal distribution with mean of $ 5 5 0 0 and standard deviation
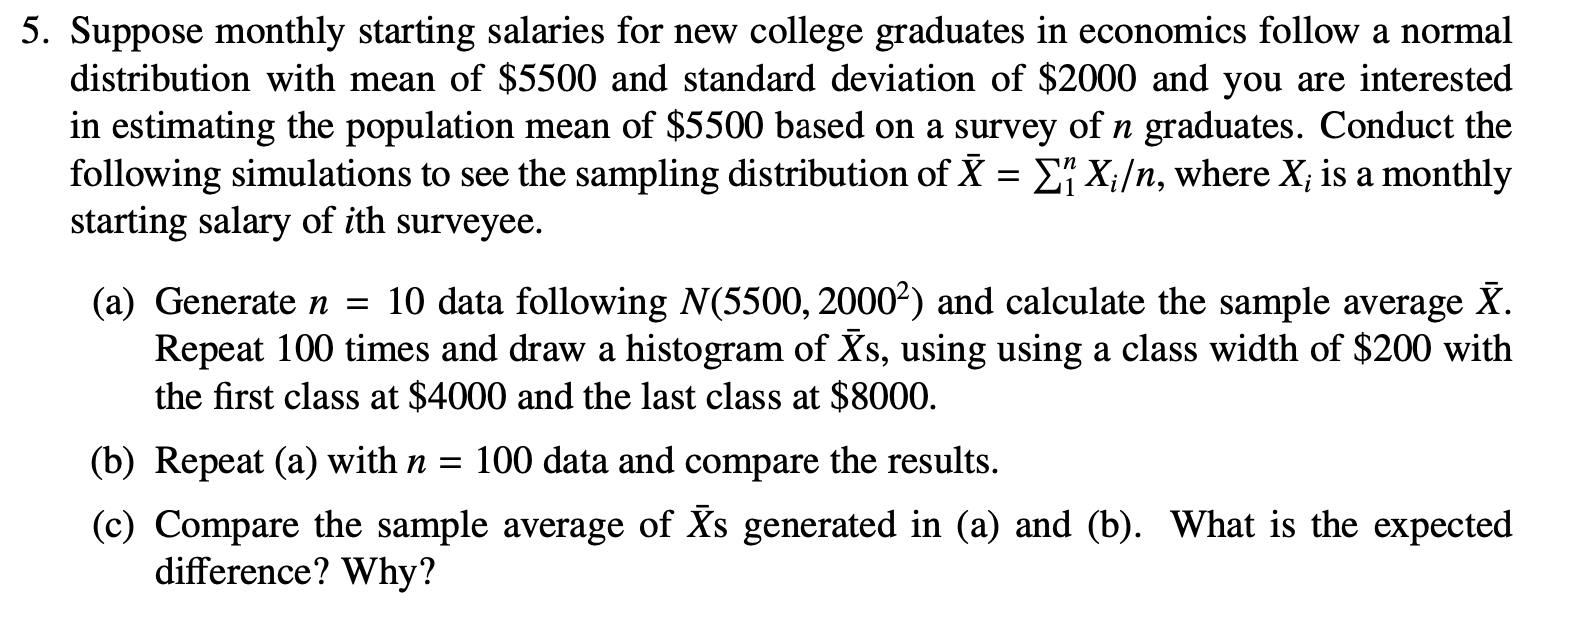
Suppose monthly starting salaries for new college graduates in economics follow a normal
distribution with mean of $ and standard deviation of $ and you are interested
in estimating the population mean of $ based on a survey of graduates. Conduct the
following simulations to see the sampling distribution of where is a monthly
starting salary of th surveyee.
a Generate data following and calculate the sample average
Repeat times and draw a histogram of s using using a class width of $ with
the first class at $ and the last class at $
b Repeat a with data and compare the results.
c Compare the sample average of generated in a and b What is the expected
difference? Why?

Step by Step Solution
There are 3 Steps involved in it
Step: 1

Get Instant Access to Expert-Tailored Solutions
See step-by-step solutions with expert insights and AI powered tools for academic success
Step: 2

Step: 3

Ace Your Homework with AI
Get the answers you need in no time with our AI-driven, step-by-step assistance
Get Started


