

Answered step by step
Verified Expert Solution
Question
1 Approved Answer
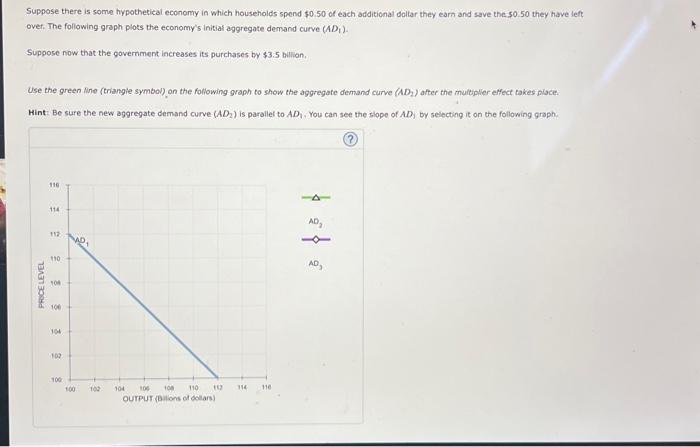
Suppose there is some hypothetical economy in which households spend $0.50 of each additional doltar they earn and save the so.50 they have left over.
Step by Step Solution
There are 3 Steps involved in it
Step: 1

Get Instant Access to Expert-Tailored Solutions
See step-by-step solutions with expert insights and AI powered tools for academic success
Step: 2

Step: 3
Ace Your Homework with AI
Get the answers you need in no time with our AI-driven, step-by-step assistance
Get Started
Accounting Act Count Think
Authors: Raad Press
1st Edition
979-8643677666