Answered step by step
Verified Expert Solution
Link Copied!

Question

1 Approved Answer

Table 1 Participant Demographics and Measures at Baseline (N = 239) Control (n = 53) Mindfulness (n = 96) Yoga (n = 90) Demographics %
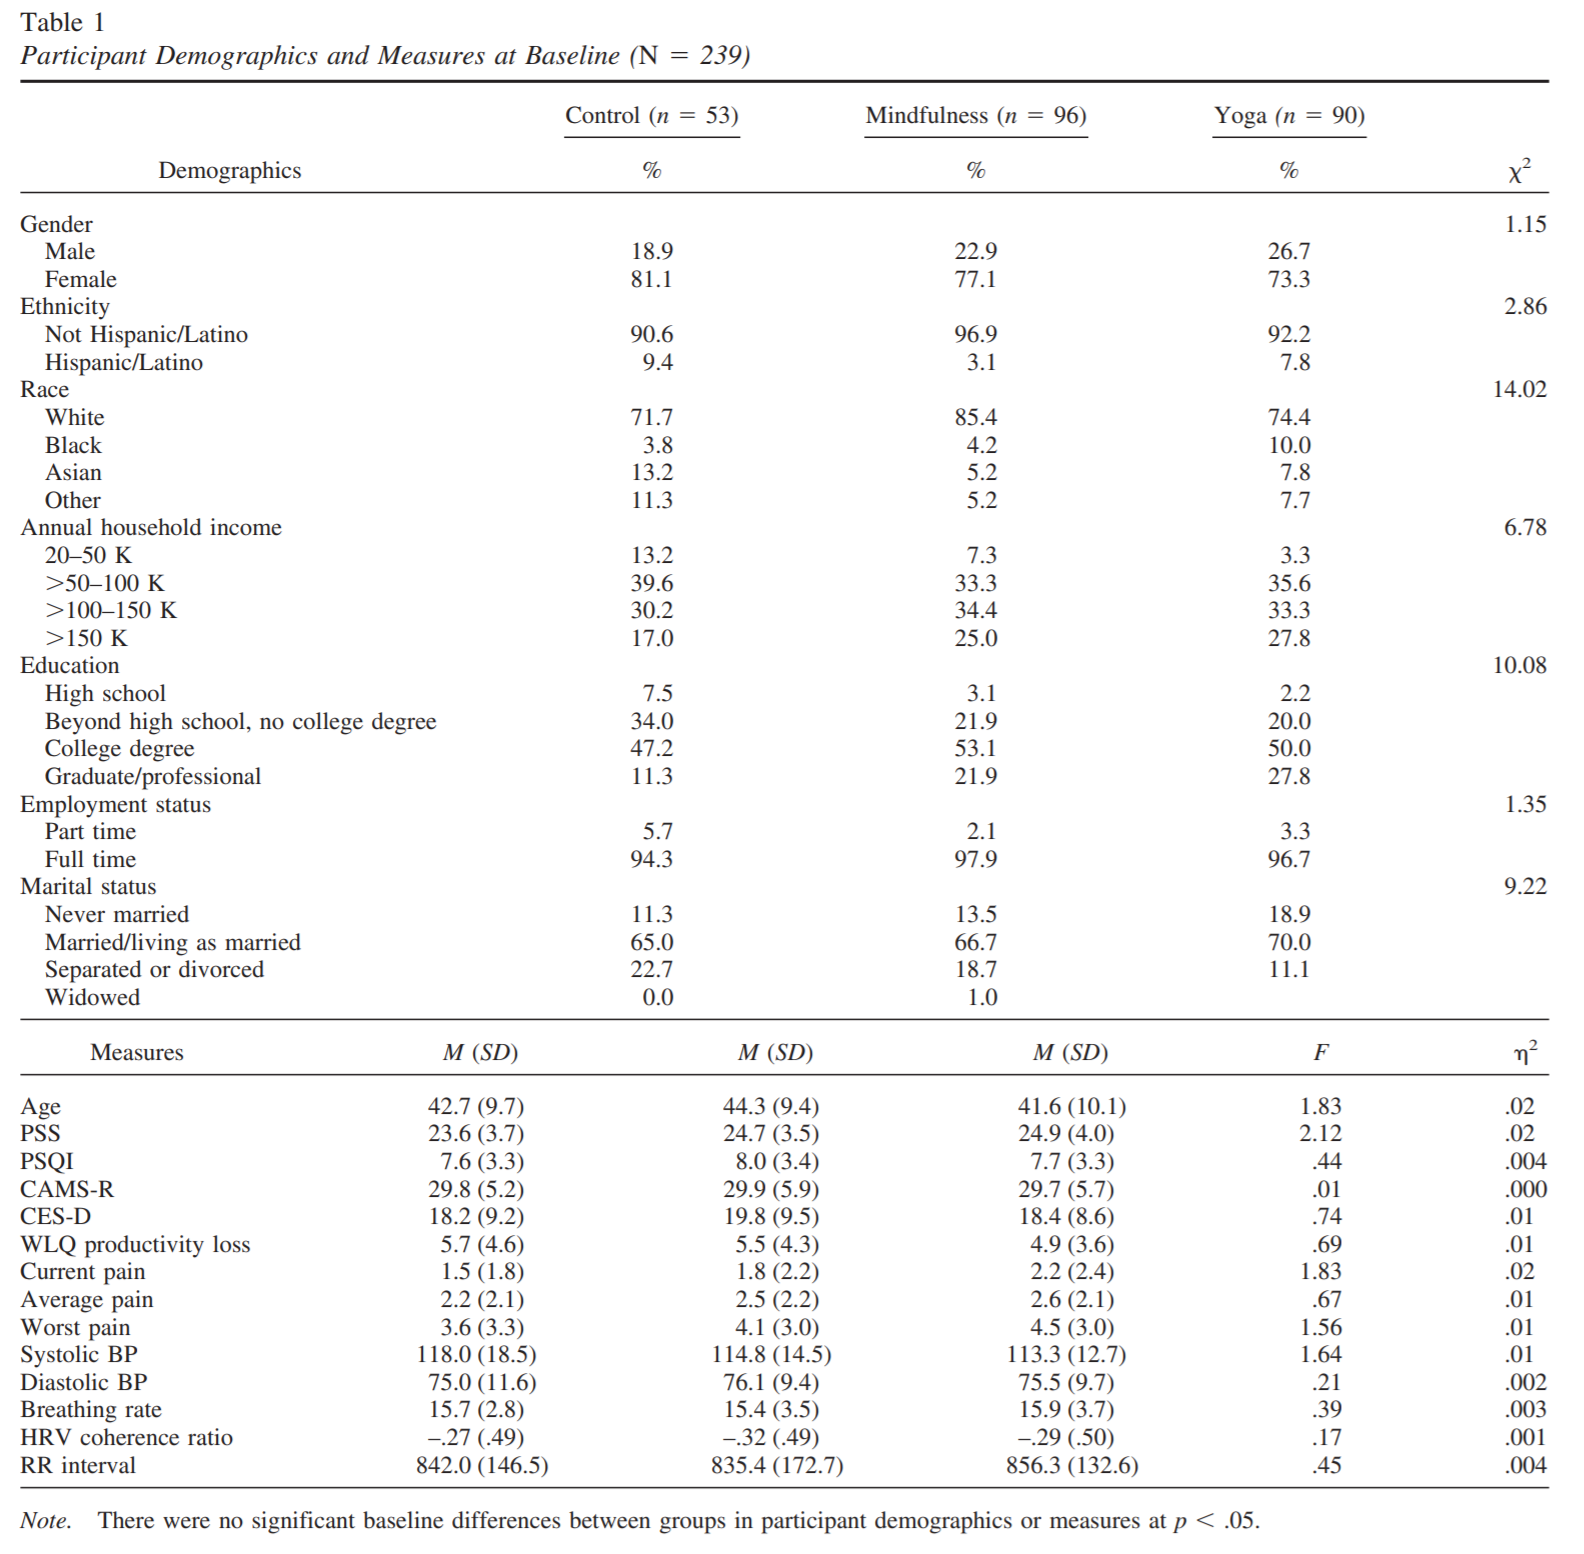
image text in transcribed
Table 1 Participant Demographics and Measures at Baseline (N = 239) Control (n = 53) Mindfulness (n = 96) Yoga (n = 90) Demographics % Gender Male 1.15 18.9 22.9 26.7 Female Ethnicity 81.1 77.1 73.3 Not Hispanic/Latino 2.86 90.6 96.9 Hispanic/Latino 92.2 9.4 3.1 7.8 Race White 71.7 14.02 Black 85.4 74.4 3.8 Asian 13.2 4.2 10.0 5.2 7.8 Other 11.3 5.2 7.7 Annual household income 20-50 K 6.78 >50-100 K 13.2 7.3 39.6 3.3 >100-150 K 33.3 30.2 35.6 34.4 >150 K 33.3 17.0 Education 25. 27.8 High school 10.08 7.5 Beyond high school, no college degree 3.1 34.0 2.2 21.9 20.0 College degree 47.2 53.1 Graduate/professional 50.0 11.3 21.9 Employment status 27.8 Part time 1.35 Full time 5.7 94.3 2.1 979 3.3 967 Marital status Never married 9.22 11.3 13.5 18.9 Married/living as married 65.0 66.7 Separated or divorced 70.0 22.7 Widowed 18.7 11.1 0.0 1.0 Measures M (SD) M (SD) M (SD) F Age 42.7 (9.7) PSS 44.3 (9.4) 23.6 (3.7) 41.6 (10.1) 24.9 (4.0) 1.83 PSQI 24.7 (3.5) 02 2.12 7.6 (3.3) .02 CAMS-R 8.0 (3.4) 7.7 (3.3) .004 CES-D 29.8 (5.2) .44 18.2 (9.2 ) 29.9 (5.9) 19.8 ( 9.5) 29.7 (5.7) .01 5.7 (4.6) 18.4 (8.6) .000 .74 WLQ productivity loss .01 Current pain 1.5 (1.8) 5.5 (4.3) 1.8 (2.2) 4.9 (3.6) 2.2 (2.4) .69 .01 1.83 Average pain 2.2 (2.1) 2.5 (2.2) .02 Worst pain 3.6 (3.3) 4.1 (3.0) 2.6 (2.1) .67 .01 Systolic BP 118.0 (18.5) 114.8 (14.5) 4.5 (3.0) 1.56 .01 Diastolic BP 75.0 (11.6) 76.1 (9.4) 113.3 (12.7) 1.64 .01 Breathing rate 15.7 (2.8) 15.4 (3.5) 75.5 (9.7) 15.9 (3.7 ) .21 .002 HRV coherence ratio -.27 (.49) .39 .003 -.32 (.49) RR interval 842.0 (146.5) 835.4 (172.7) -.29 (.50) 856.3 (132.6) .17 45 .001 004 Note. There were no significant baseline differences between groups in participant demographics or measures at p

Step by Step Solution

There are 3 Steps involved in it

Step: 1

blur-text-image

Get Instant Access to Expert-Tailored Solutions

See step-by-step solutions with expert insights and AI powered tools for academic success

Step: 2

blur-text-image_2

Step: 3

blur-text-image_3

Ace Your Homework with AI

Get the answers you need in no time with our AI-driven, step-by-step assistance

Get Started

Recommended Textbook for

Understanding Financial Statements

Authors: Lyn FraserAlexa Fox, Judy Strauss, William Briggs, Mario Triola, S Certo, S. Certo, Philip Kotler, Robert Anthony, Barry Monk, Jaan Kiusalaas, R.C. Hi

10th Edition

0132655063, 9780132655064

More Books

Students also viewed these Mathematics questions

Question

In what circumstances may an insurer cancel a policy?

Answered: 1 week ago