Thanks for the help.
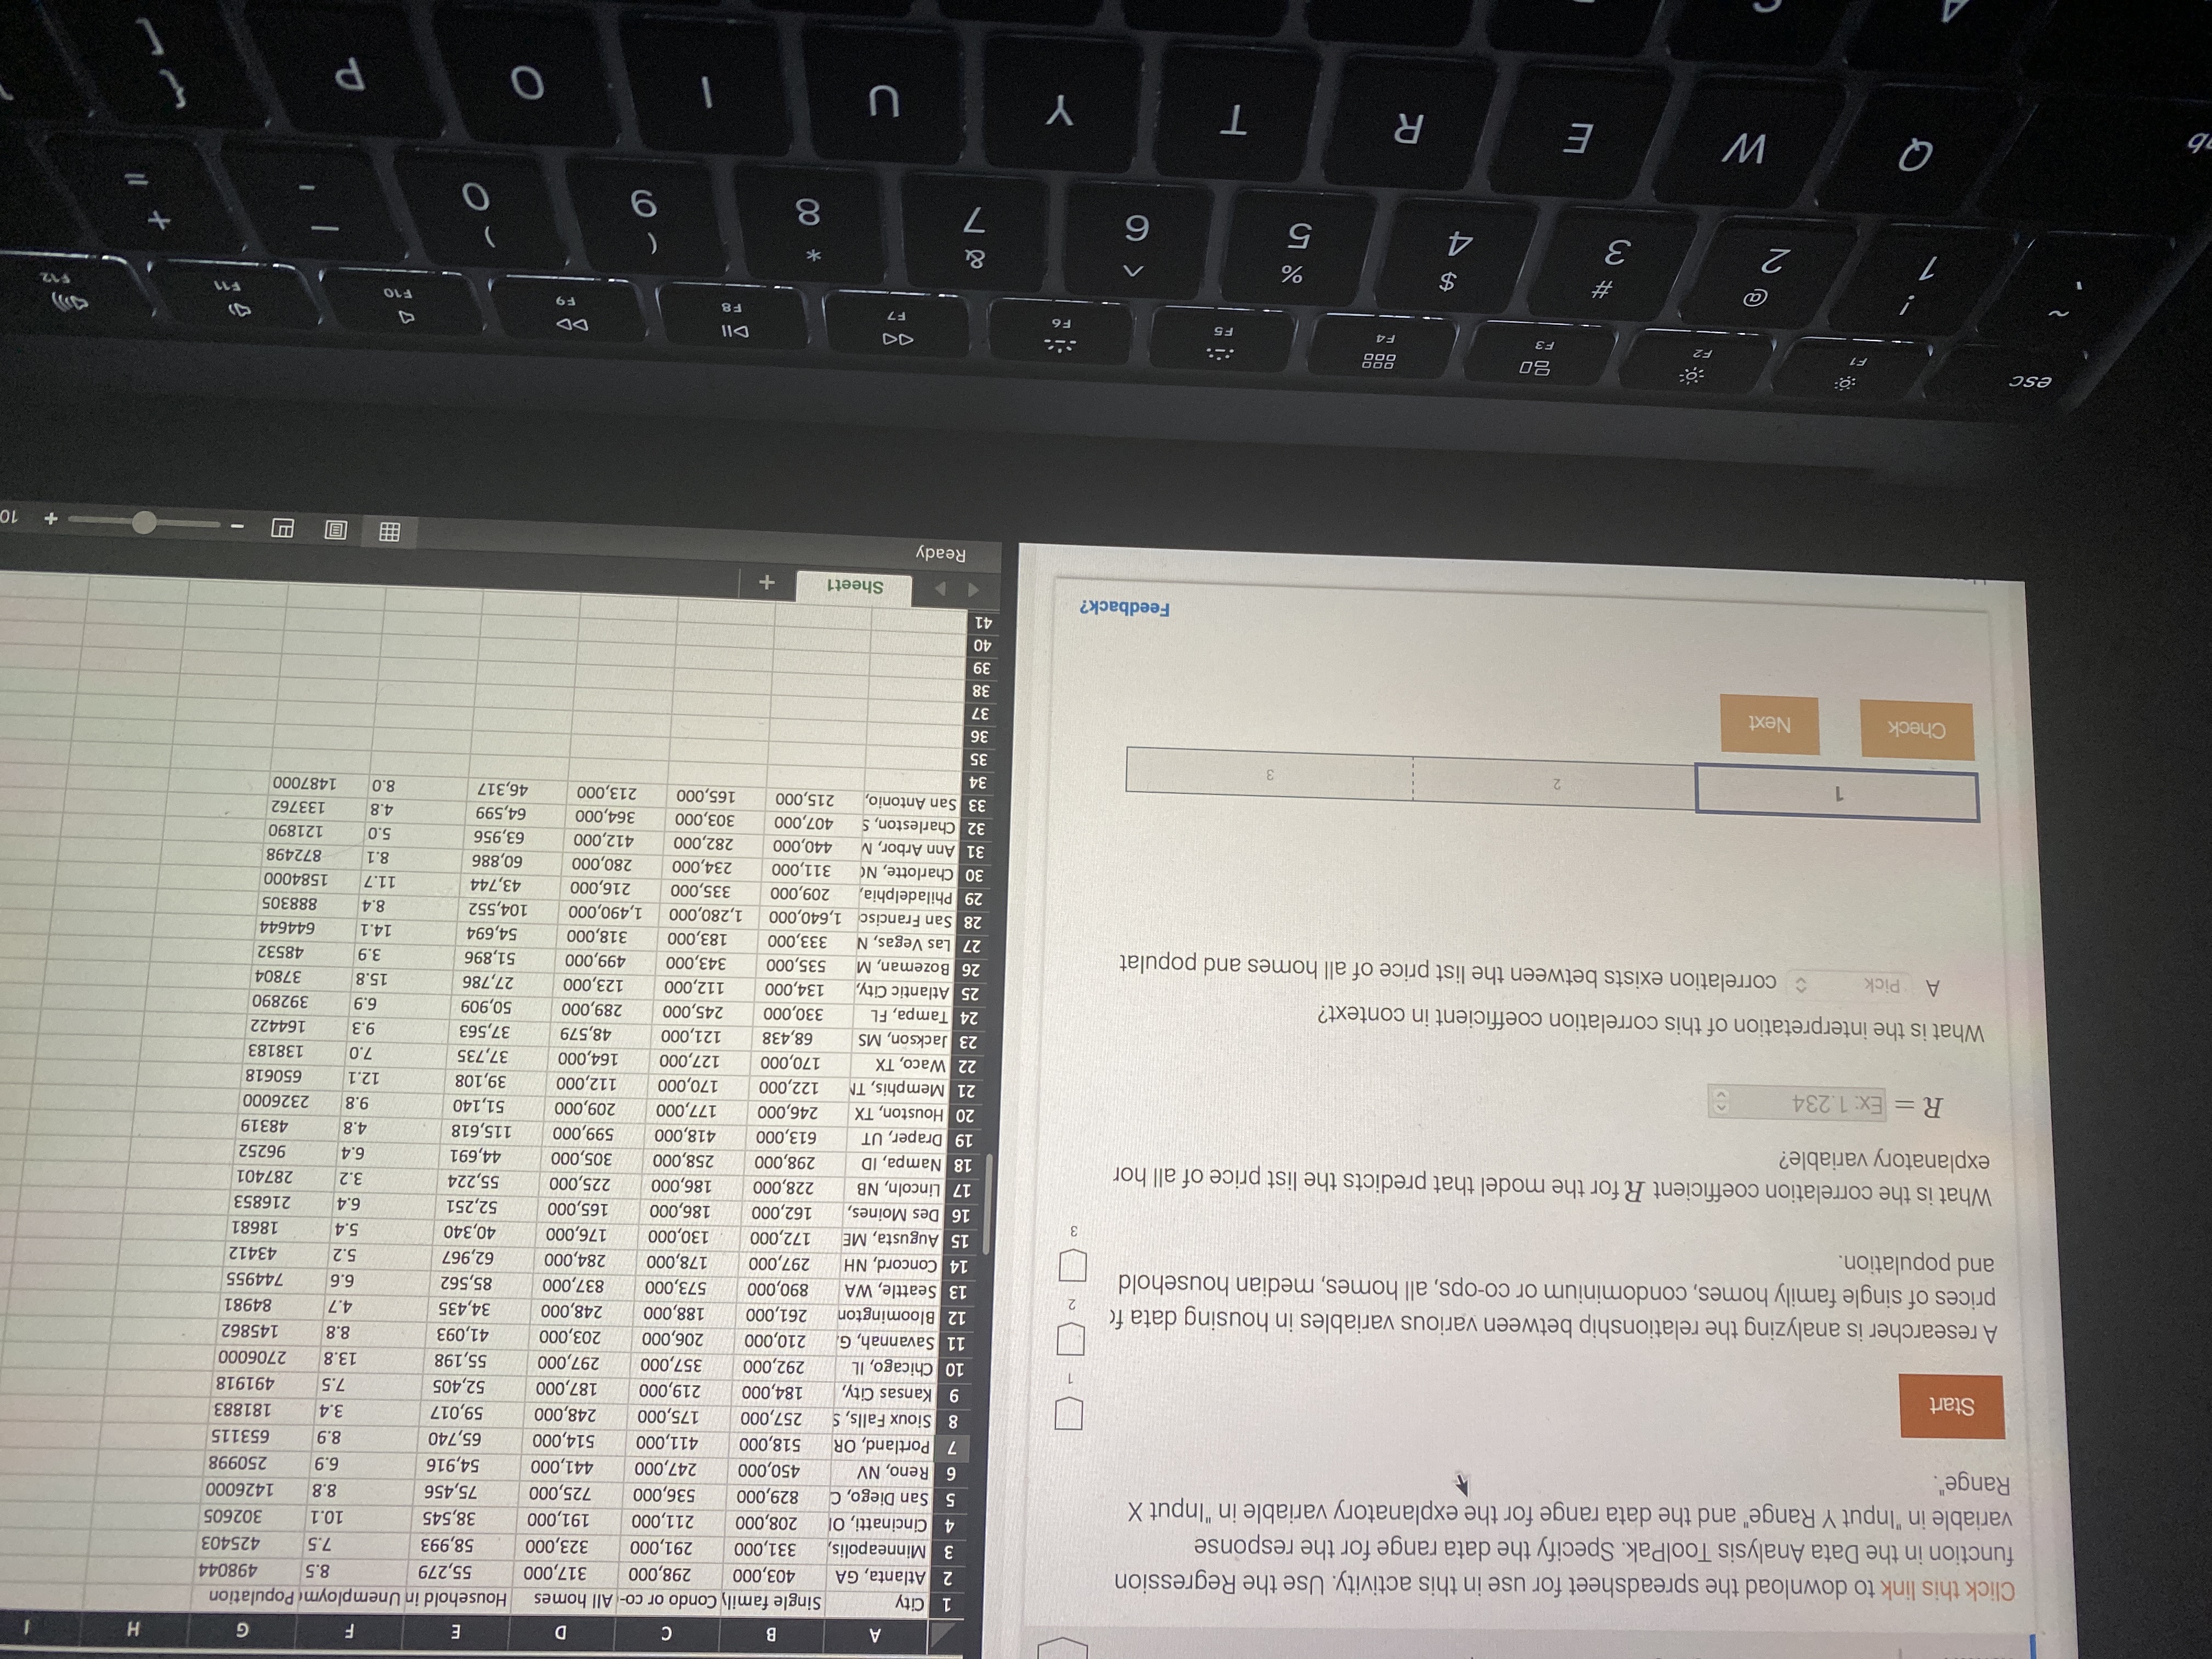
G H 1 City Single family Condo or co- All homes Household in Unemploymentlation Click this link to download the spreadsheet for use in this activity. Use the Regression Atlanta, GA 403,000 298,000 317,000 55,279 8.5 498044 Minneapolis, 331,000 291,000 323,000 58,993 7.5 425403 function in the Data Analysis ToolPak. Specify the data range for the response 4 Cincinatti, Ol 208,000 211,000 191,000 38,545 10.1 302605 variable in "Input Y Range" and the data range for the explanatory variable in "Input X 5 San Diego, C 829,000 536,000 725,000 75,456 8.8 1426000 450,000 247,000 441,000 54,916 6.9 250998 Range". 6 Reno, NV 7 Portland, OR 518,000 411,000 514,000 65,740 8.9 65311 8 Sioux Falls, S 257,000 175,000 248,000 59,017 3.4 181883 9 Kansas City, 184,000 219,000 187,000 52,405 7.5 491918 Start 10 Chicago, IL 292,000 357,00 297,00 55,198 13.8 2706000 11 Savannah, G. 210,000 206,000 203,000 41,093 8.8 145862 2 Bloomington 261,000 188,000 248,000 34,435 4.7 84981 A researcher is analyzing the relationship between various variables in housing data fo 13 Seattle, WA 890,000 573,000 837,000 85,562 6.6 744955 prices of single family homes, condominium or co-ops, all homes, median household 14 Concord, NH 297,000 178,000 284,000 62,967 5.2 43412 and population. 15 Augusta, ME 172,000 130,000 176,000 40,340 5.4 18681 16 Des Moines, 162,000 186,000 165,000 52,251 6.4 216853 17 Lincoln, NB 228,000 186,000 225,000 55,224 3.2 287401 What is the correlation coefficient R for the model that predicts the list price of all hor 18 Nampa, ID 298,000 258,000 305,000 44,691 6.4 96252 explanatory variable? 19 Draper, UT 613,000 418,000 599,000 115,618 4.8 48319 20 Houston, TX 246,000 177,000 209,000 51,140 9.8 2326000 R = Ex: 1.234 21 Memphis, TN 122,000 170,000 112,000 39,108 12.1 650618 22 V 170,000 127,000 164,000 37,735 7.0 13818 Jackson, MS 68,438 121,000 48,579 37,563 9.3 164422 6.9 What is the interpretation of this correlation coefficient in context? 24 Tampa, FL 330,000 245,000 289,000 50,909 392890 25 Atlantic City, 134,000 112,000 123,000 27,786 15.8 37804 A Pick correlation exists between the list price of all homes and populat 26 Bozeman, M 535,000 343,000 499,000 51,896 3.9 48532 27 Las Vegas, N 333,000 183,000 318,000 54,694 14.1 644644 28 San Francisc 1,640,000 1,280,000 1,490,000 104,552 8.4 888305 Philadelphia, 209,000 335,000 216,000 43,744 11.7 1584000 30 Charlotte , NC 311,000 234,000 280,000 60 ,886 8.1 872498 31 Ann Arbor, M 440,000 282,000 412,000 63 ,956 5.0 121890 32 Charleston, S 407,000 303,000 364,000 64,599 4.8 133762 San Antonio, 215,000 165,000 213,000 46,317 8.0 1487000 1 34 35 Check Next Feedback? Sheet1 + Ready esc F1 F2 20 E6 E7 $12 a Vo 2 3 4 6 O O Q W E R T Y U O P