Question
The attached data captures some details about new Food and Beverage (F&B) product launches across the world. Below are some notes around various files. Product
The attached data captures some details about new Food and Beverage (F&B) product launches across the world. Below are some notes around various files.
- Product Launch Dataset.csv
- The column names are self-explanatory; feel free to make relevant assumptions.
- Each product could come in combination of multiple flavors. Each unique flavor used in a product is separated from another by a semicolon (;). E.g. Product ID #10 states: "Cherry, not specified; Vanilla, not specified." This means product #10 comes in a combination of two unique flavors. The first flavor "Cherry, not specified" means the flavor is Cherry but it is not mentioned what particular type of Cherry flavor is used (e.g Red Cherry or Black Cherry). Similarly, for the second flavour.
- The "Launch date" represents the date on which a product was launched.
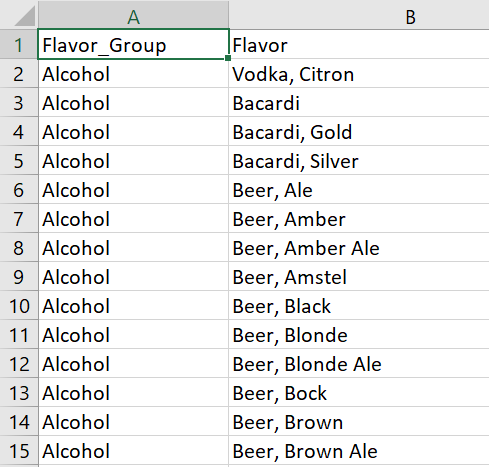
- Flavor Classification Dataset. csv
Maps each unique flavor to a "Flavor Group".
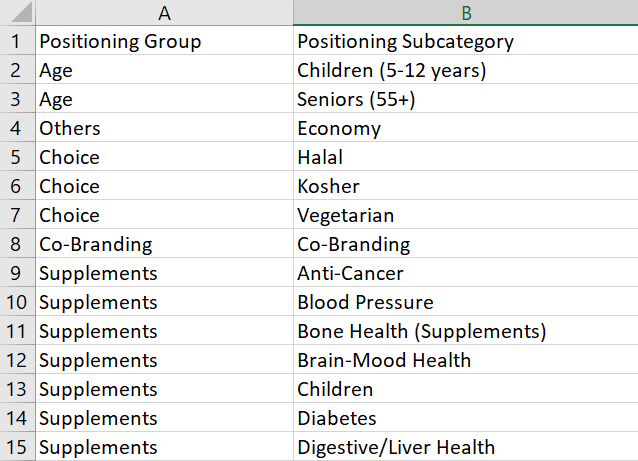
- Positioning Category Mapping Dataset. csv
Each product (as specified by a product ID) could come in combination of multiple positioning categories. This file maps each unique positioning category to a "Positioning Group".
Questions
- Among other things of interest in the presentation, identify the top 10 emerging flavors over the last 5 years available in the data. Explain your solution approach.
- If you are the Brand Manager in CPG - Foods business (in a category say Iced Tea), and you need to decide whether to launch a new brand variant in the market in addition to the flavors you already have. What data and analyses will you use (in addition to what you have here), to decide whether to launch a new SKUs or retain the existing SKUs, or even remove some of the existing SKUs?
Please do share any supporting analysis you might have made on spreadsheets / visualization tools, OR the Python / R workbook used to solve the case.
I have attached snippets of data. Kindly work with those as I cannot attach the dataset. I am looking for the approach here mainly.


Step by Step Solution
There are 3 Steps involved in it
Step: 1

Get Instant Access to Expert-Tailored Solutions
See step-by-step solutions with expert insights and AI powered tools for academic success
Step: 2

Step: 3

Ace Your Homework with AI
Get the answers you need in no time with our AI-driven, step-by-step assistance
Get Started


