Answered step by step
Verified Expert Solution
Question
1 Approved Answer
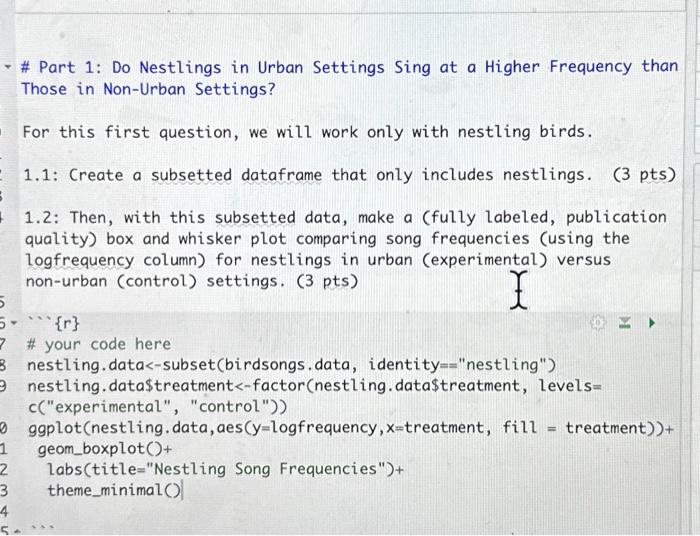
the box plot is already done i need help with the statistical test and analysis # Part 1: Do Nestlings in Urban Settings Sing at
the box plot is already done i need help with the statistical test and analysis 


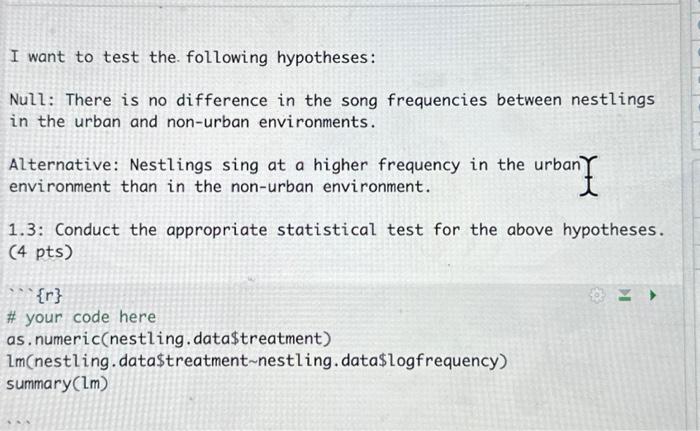
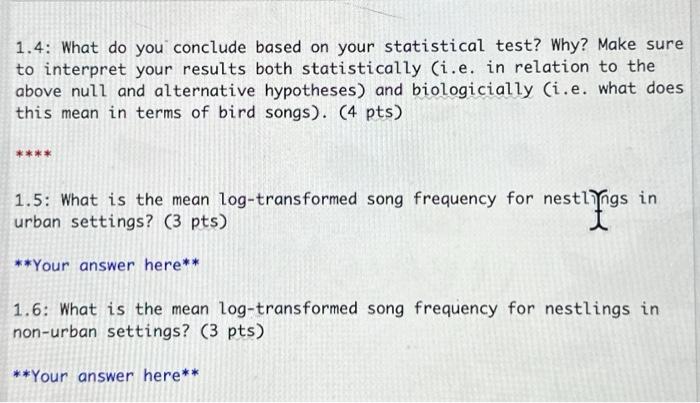
\# Part 1: Do Nestlings in Urban Settings Sing at a Higher Frequency than Those in Non-Urban Settings? For this first question, we will work only with nestling birds. 1.1: Create a subsetted dataframe that only includes nestlings. (3 pts) 1.2: Then, with this subsetted data, make a (fully labeled, publication quality) box and whisker plot comparing song frequencies (using the logfrequency column) for nestlings in urban (experimental) versus non-urban (control) settings. (3 pts) {r} \# your code here nestling.data(y=logf requency, x= treatment, fill = treatment ))+ geom_boxplot ()+ labs (title="Nestling Song Frequencies")+ theme_minimal() I want to test the following hypotheses: Null: There is no difference in the song frequencies between nestlings in the urban and non-urban environments. Alternative: Nestlings sing at a higher frequency in the urban environment than in the non-urban environment. environment than in the non-urban environment. 1.3: Conduct the appropriate statistical test for the above hypotheses. (4 pts) {r} \# your code here as. numeric(nestling. data\$treatment) lm(nestling. data\$treatment nestling. data\$logfrequency) summary (lm) 1.4: What do you conclude based on your statistical test? Why? Make sure to interpret your results both statistically (i.e. in relation to the above null and alternative hypotheses) and biologicially (i.e. what does this mean in terms of bird songs). (4 pts) 1.5: What is the mean log-transformed song frequency for nestlngs in urban settings? (3 pts) **Your answer here** 1.6: What is the mean log-transformed song frequency for nestlings in non-urban settings? ( 3 pts) **Your answer here** 


Step by Step Solution
There are 3 Steps involved in it
Step: 1

Get Instant Access to Expert-Tailored Solutions
See step-by-step solutions with expert insights and AI powered tools for academic success
Step: 2

Step: 3

Ace Your Homework with AI
Get the answers you need in no time with our AI-driven, step-by-step assistance
Get Started


