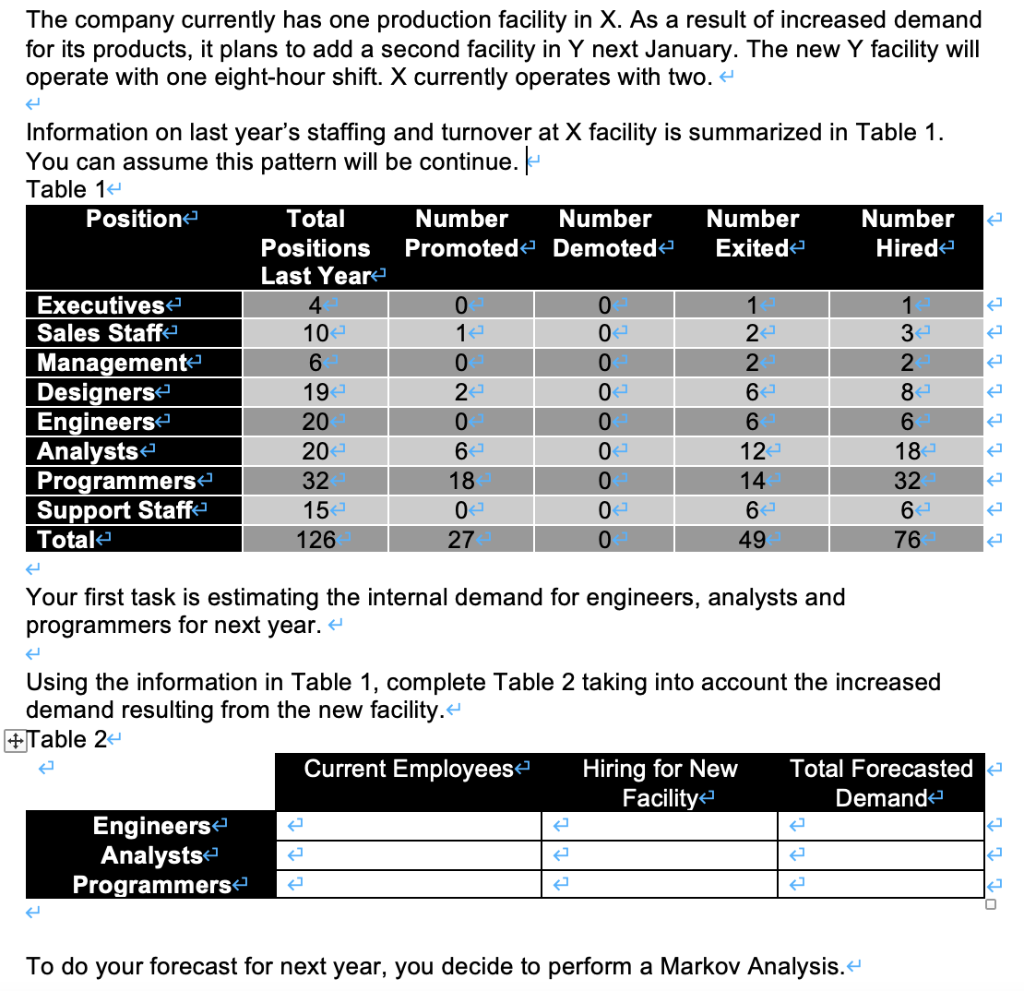
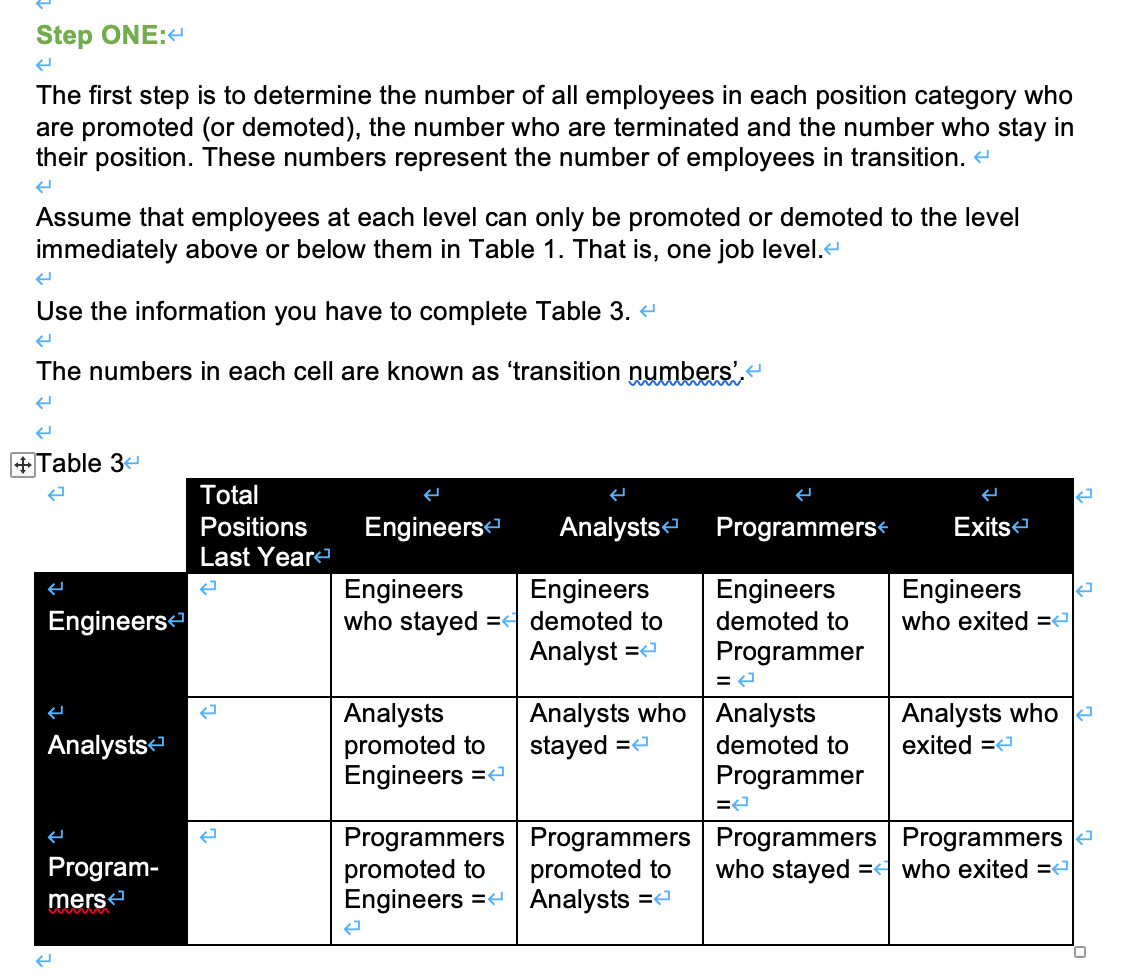
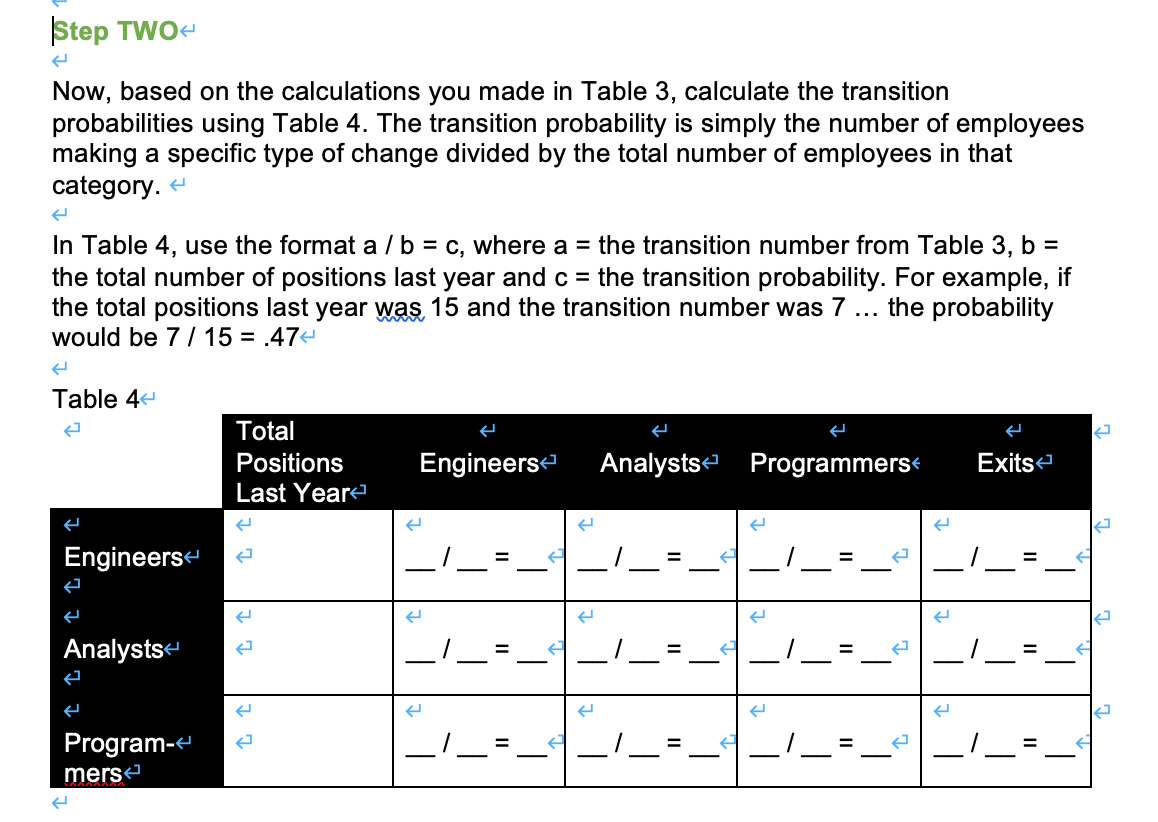
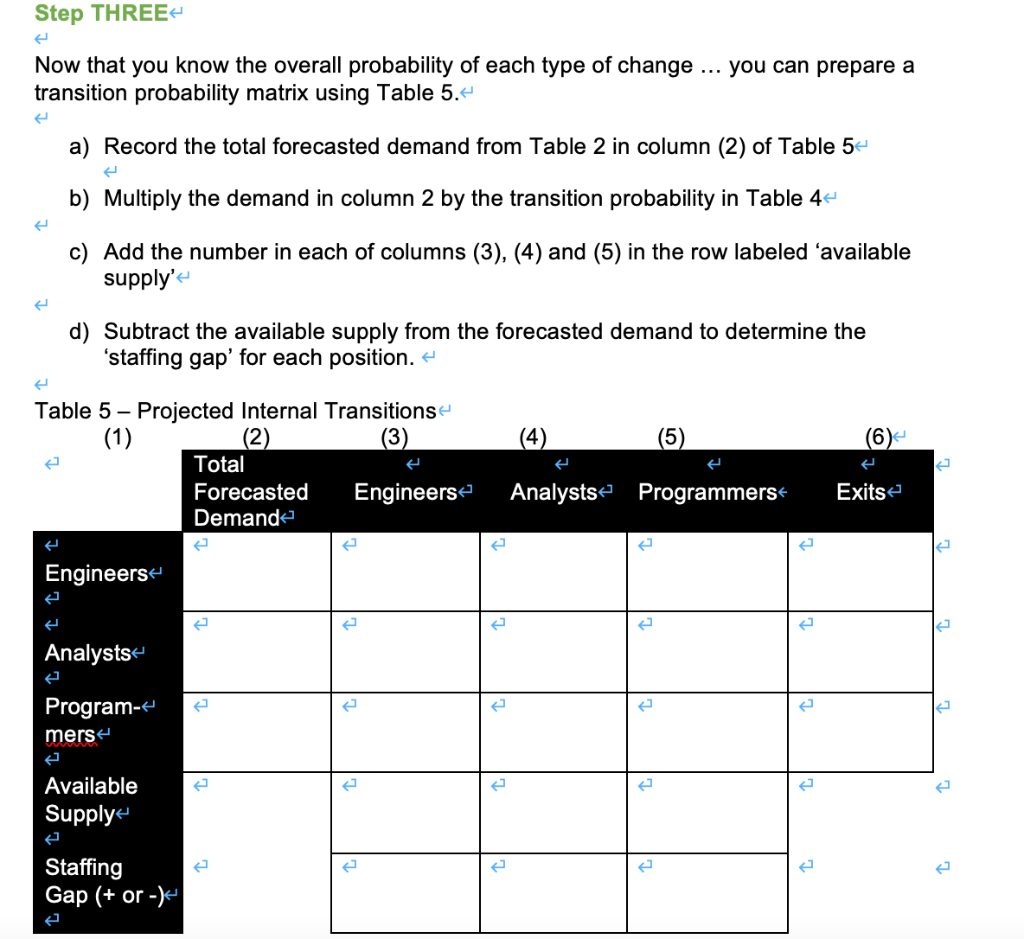

The company currently has one production facility in X. As a result of increased demand for its products, it plans to add a second facility in Y next January. The new y facility will operate with one eight-hour shift. X currently operates with two. Information on last year's staffing and turnover at X facility is summarized in Table 1. You can assume this pattern will be continue.- Table 1 Position Total Number Number Number Number Positions Promoted Demoted Exitede Hirede Last Year Executives 4 0 0 1 1 Sales Staff 10 12 0 2 3 Management 6 0 0 2 2 Designers 2 0 6 82 Engineers 20 0 0 6 6 Analysts 20 6 02 18 Programmers 32 18 0 14 32 Support Staff 0 0 6- 6 Totale 126 27 0 49 76 19- 12 15 Your first task is estimating the internal demand for engineers, analysts and programmers for next year. 4 Using the information in Table 1, complete Table 2 taking into account the increased demand resulting from the new facility. +Table 2- Current Employees Hiring for New Total Forecasted Facility Demande Engineers Analysts Programmers To do your forecast for next year, you decide to perform a Markov Analysis. Step ONE:4 The first step is to determine the number of all employees in each position category who are promoted (or demoted), the number who are terminated and the number who stay in their position. These numbers represent the number of employees in transition. + Assume that employees at each level can only be promoted or demoted to the level immediately above or below them in Table 1. That is, one job level. Use the information you have to complete Table 3. 4 The numbers in each cell are known as transition numbers'. #Table 34 Total Positions Last Year Engineers Analysts Programmers Exits K Engineers Engineers who stayed = demoted to Analyst = Engineers Engineers demoted to Programmer Engineers who exited = = Analysts promoted to Engineers = Analysts Analysts who Analysts stayed =4 demoted to Programmer Analysts who exited = = - Program- mers Programmers Programmers Programmers Programmers promoted to promoted to who stayed = who exited = Engineers = Analysts = Step TWO- Now, based on the calculations you made in Table 3, calculate the transition probabilities using Table 4. The transition probability is simply the number of employees making a specific type of change divided by the total number of employees in that category. + e In Table 4, use the format a/b = c, where a = the transition number from Table 3, b = the total number of positions last year and c = the transition probability. For example, if the total positions last year was, 15 and the transition number was 7 ... the probability would be 7/15 = .474 Table 4 Total PC itions Engineerse Analysts Programmers Exits Last Year Engineers Analysts I Il ! Program- mers _!_ Step THREE you can prepare a Now that you know the overall probability of each type of change transition probability matrix using Table 5. a) Record the total forecasted demand from Table 2 in column (2) of Table 5 b) Multiply the demand in column 2 by the transition probability in Table 4- Add the number in each of columns (3), (4) and (5) in the row labeled 'available supply'- d) Subtract the available supply from the forecasted demand to determine the 'staffing gap' for each position. (4) (6) Table 5 - Projected Internal Transitions (1) (2) (3) Total Forecasted Engineers Demande Analysts Programmers Exits Engineers Analysts Program- mers Available Supply Staffing Gap (+ or -) Step FOUR Based on the above analysis, summarize your conclusions. What would you tell your client? And, considering the current external environment, what additional observations or recommendations would you make? The company currently has one production facility in X. As a result of increased demand for its products, it plans to add a second facility in Y next January. The new y facility will operate with one eight-hour shift. X currently operates with two. Information on last year's staffing and turnover at X facility is summarized in Table 1. You can assume this pattern will be continue.- Table 1 Position Total Number Number Number Number Positions Promoted Demoted Exitede Hirede Last Year Executives 4 0 0 1 1 Sales Staff 10 12 0 2 3 Management 6 0 0 2 2 Designers 2 0 6 82 Engineers 20 0 0 6 6 Analysts 20 6 02 18 Programmers 32 18 0 14 32 Support Staff 0 0 6- 6 Totale 126 27 0 49 76 19- 12 15 Your first task is estimating the internal demand for engineers, analysts and programmers for next year. 4 Using the information in Table 1, complete Table 2 taking into account the increased demand resulting from the new facility. +Table 2- Current Employees Hiring for New Total Forecasted Facility Demande Engineers Analysts Programmers To do your forecast for next year, you decide to perform a Markov Analysis. Step ONE:4 The first step is to determine the number of all employees in each position category who are promoted (or demoted), the number who are terminated and the number who stay in their position. These numbers represent the number of employees in transition. + Assume that employees at each level can only be promoted or demoted to the level immediately above or below them in Table 1. That is, one job level. Use the information you have to complete Table 3. 4 The numbers in each cell are known as transition numbers'. #Table 34 Total Positions Last Year Engineers Analysts Programmers Exits K Engineers Engineers who stayed = demoted to Analyst = Engineers Engineers demoted to Programmer Engineers who exited = = Analysts promoted to Engineers = Analysts Analysts who Analysts stayed =4 demoted to Programmer Analysts who exited = = - Program- mers Programmers Programmers Programmers Programmers promoted to promoted to who stayed = who exited = Engineers = Analysts = Step TWO- Now, based on the calculations you made in Table 3, calculate the transition probabilities using Table 4. The transition probability is simply the number of employees making a specific type of change divided by the total number of employees in that category. + e In Table 4, use the format a/b = c, where a = the transition number from Table 3, b = the total number of positions last year and c = the transition probability. For example, if the total positions last year was, 15 and the transition number was 7 ... the probability would be 7/15 = .474 Table 4 Total PC itions Engineerse Analysts Programmers Exits Last Year Engineers Analysts I Il ! Program- mers _!_ Step THREE you can prepare a Now that you know the overall probability of each type of change transition probability matrix using Table 5. a) Record the total forecasted demand from Table 2 in column (2) of Table 5 b) Multiply the demand in column 2 by the transition probability in Table 4- Add the number in each of columns (3), (4) and (5) in the row labeled 'available supply'- d) Subtract the available supply from the forecasted demand to determine the 'staffing gap' for each position. (4) (6) Table 5 - Projected Internal Transitions (1) (2) (3) Total Forecasted Engineers Demande Analysts Programmers Exits Engineers Analysts Program- mers Available Supply Staffing Gap (+ or -) Step FOUR Based on the above analysis, summarize your conclusions. What would you tell your client? And, considering the current external environment, what additional observations or recommendations would you make