

Question
The consolidated balance sheets and statements of income for Whole Foods Market, Inc. for the fiscal years ended 2010 and 2009 are included in the
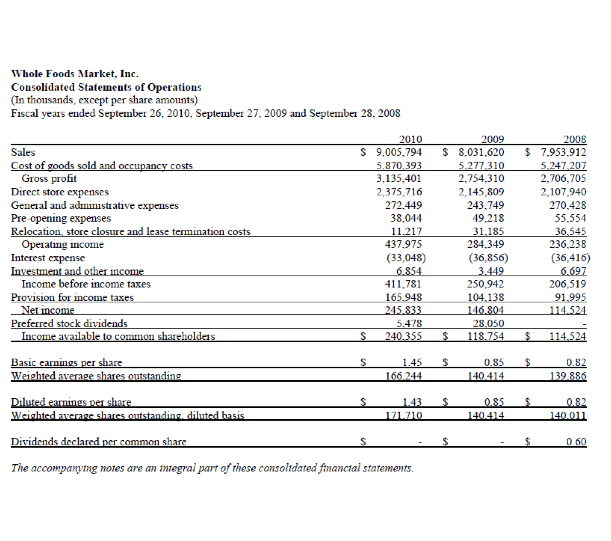
The consolidated balance sheets and statements of income for Whole Foods Market, Inc. for the fiscal years ended 2010 and 2009 are included in the following two pages. In addition, the notes to the companys financial statements included the following item:
Inventories
We value our inventories at the lower of cost or market. Cost was determined using the last-in, first-out (LIFO) method for its inventories in fiscal years 2010 and 2009. Under the LIFO method, the cost assigned to items sold is based on the cost of the most recent items purchased. As a result, the costs of the first items purchased remain in inventory and are used to value ending inventory. The excess of estimated current costs over LIFO carrying value, or LIFO reserve, was approximately $19.4 million and $27.1 million at September 26, 2010 and September 27, 2009, respectively.
a) What would ending inventories have been under the first-in, first-out cost flow assumption at the end of 2010 and 2009?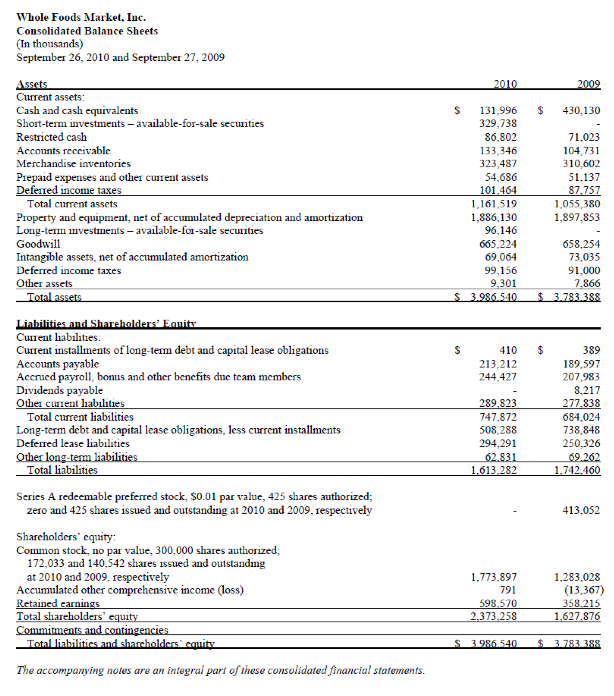
 [Pay attention to whether the numbers are in millions or thousands]
b) What would cost of goods sold have been in 2010 under the first-in, first-out cost flow assumption?
c) What can you infer about price level changes in 2010? Explain your reasoning
d) Did the company declare any dividend in 2010 (including preferred dividend)?
e)how much total dividend did the company distribute to the owner (investors)? Provide your reasoning.
Whole Foods Market, Inc. Consolidated Balance Sheets (In thousands) September 26, 2010 and September 27, 2009 2010 2009 $ 430,130 Assets Current assets: Cash and cash equivalents Short-term investments - available-for-sale securities Restricted cash Accounts receivable Merchandise inventories Prepaid expenses and other current assets Deferred income taxes Total current assets Property and equipment, net of accumulated depreciation and amortization Long-term investments - available-for-sale securities Goodwill Intangible assets, net of accumulated amortization Deferred income taxes Other assets Total assets 131,996 329,738 86,802 133,346 323,487 54.686 101.464 1,161,519 1,886,130 96,146 665.224 69,064 99,156 9,301 3.986.540 71.023 104 731 310,602 51.137 87.757 1,055 380 1,897.853 658.254 73,035 91.000 7.866 3.783.388 $ $ $ $ 410 213,212 244,427 Liabilities and Shareholders' Equity Current liabilities. Current installments of long-term debt and capital lease obligations Accounts payable Accrued payroll, bonus and other benefits due team members Dividends payable Other current liabilities Total current liabilities Long-term debt and capital lease obligations, less current installments Deferred lease liabilities Other long-term liabilities Total liabilities 289,823 747.872 508.288 294,291 62.831 1.613.282 389 189,597 207.983 8.217 277.838 684.024 738.848 250.326 69.262 1.742.460 Series A redeemable preferred stock. $0.01 par value, 425 shares authorized; zero and 425 shares issued and outstanding at 2010 and 2009, respectively 413.052 Shareholders' equity Common stock, no par value, 300.000 shares authorized 172,033 and 140,542 shares issued and outstanding at 2010 and 2009. respectively Accumulated other comprehensive income (loss) Retained earnings Total shareholders' equity Commitments and contingencies Total liabilities and shareholders' comits 1.773.897 791 598 570 2.373.258 1.283.028 (13,367) 358.215 1.627.876 $ 3.986.540 $ 3.783388 The accompanying notes are an integral part of these consolidated financial statements. Whole Foods Market, Inc. Consolidated Statements of Operations (In thousands, except per share amounts) Fiscal years ended September 26, 2010. September 27, 2009 and September 28, 2008 S $ $ Sales Cost of goods sold and occupancy costs Gross profit Direct store expenses General and administrative expenses Pre opening expenses Relocation, store closure and lease termination costs Operating income Interest expense Investment and other income Income before income taxes Provision for income taxes Net income Preferred stock dividends Income available to common shareholders 2010 9.005.794 5.870.393 3.135.401 2,375, 716 272.449 38.044 11.217 437.975 (33,048) 6.854 411,781 165.948 245.833 5.478 240.355 2009 8.031.620 5.277,310 2,754,310 2,145,809 243,749 49.218 31.185 284,349 (36,856) 3.449 250,942 104,138 146.804 28.050 118.754 2008 7.953.912 5,247 207 2,706,705 2,107,940 270,428 55.554 36,545 236.238 (36,416) 6.097 206,519 91,995 114.524 S $ S 114.524 S $ $ Basic earnings per share Weighted average shares outstanding 1.45 166.244 0.85 1 40.414 0.82 139.886 S $ $ Diluted earnings per share Weighted average shares outstanding. diluted basis 1.43 171.710 0,85 1 40414 0.82 40.00 Dividends declared per common share $ $ 0.60 The accompanying notes are an integral part of these consolidated financial statements. Whole Foods Market, Inc. Consolidated Balance Sheets (In thousands) September 26, 2010 and September 27, 2009 2010 2009 $ 430,130 Assets Current assets: Cash and cash equivalents Short-term investments - available-for-sale securities Restricted cash Accounts receivable Merchandise inventories Prepaid expenses and other current assets Deferred income taxes Total current assets Property and equipment, net of accumulated depreciation and amortization Long-term investments - available-for-sale securities Goodwill Intangible assets, net of accumulated amortization Deferred income taxes Other assets Total assets 131,996 329,738 86,802 133,346 323,487 54.686 101.464 1,161,519 1,886,130 96,146 665.224 69,064 99,156 9,301 3.986.540 71.023 104 731 310,602 51.137 87.757 1,055 380 1,897.853 658.254 73,035 91.000 7.866 3.783.388 $ $ $ $ 410 213,212 244,427 Liabilities and Shareholders' Equity Current liabilities. Current installments of long-term debt and capital lease obligations Accounts payable Accrued payroll, bonus and other benefits due team members Dividends payable Other current liabilities Total current liabilities Long-term debt and capital lease obligations, less current installments Deferred lease liabilities Other long-term liabilities Total liabilities 289,823 747.872 508.288 294,291 62.831 1.613.282 389 189,597 207.983 8.217 277.838 684.024 738.848 250.326 69.262 1.742.460 Series A redeemable preferred stock. $0.01 par value, 425 shares authorized; zero and 425 shares issued and outstanding at 2010 and 2009, respectively 413.052 Shareholders' equity Common stock, no par value, 300.000 shares authorized 172,033 and 140,542 shares issued and outstanding at 2010 and 2009. respectively Accumulated other comprehensive income (loss) Retained earnings Total shareholders' equity Commitments and contingencies Total liabilities and shareholders' comits 1.773.897 791 598 570 2.373.258 1.283.028 (13,367) 358.215 1.627.876 $ 3.986.540 $ 3.783388 The accompanying notes are an integral part of these consolidated financial statements. Whole Foods Market, Inc. Consolidated Statements of Operations (In thousands, except per share amounts) Fiscal years ended September 26, 2010. September 27, 2009 and September 28, 2008 S $ $ Sales Cost of goods sold and occupancy costs Gross profit Direct store expenses General and administrative expenses Pre opening expenses Relocation, store closure and lease termination costs Operating income Interest expense Investment and other income Income before income taxes Provision for income taxes Net income Preferred stock dividends Income available to common shareholders 2010 9.005.794 5.870.393 3.135.401 2,375, 716 272.449 38.044 11.217 437.975 (33,048) 6.854 411,781 165.948 245.833 5.478 240.355 2009 8.031.620 5.277,310 2,754,310 2,145,809 243,749 49.218 31.185 284,349 (36,856) 3.449 250,942 104,138 146.804 28.050 118.754 2008 7.953.912 5,247 207 2,706,705 2,107,940 270,428 55.554 36,545 236.238 (36,416) 6.097 206,519 91,995 114.524 S $ S 114.524 S $ $ Basic earnings per share Weighted average shares outstanding 1.45 166.244 0.85 1 40.414 0.82 139.886 S $ $ Diluted earnings per share Weighted average shares outstanding. diluted basis 1.43 171.710 0,85 1 40414 0.82 40.00 Dividends declared per common share $ $ 0.60 The accompanying notes are an integral part of these consolidated financial statements
Step by Step Solution
There are 3 Steps involved in it
Step: 1

Get Instant Access to Expert-Tailored Solutions
See step-by-step solutions with expert insights and AI powered tools for academic success
Step: 2

Step: 3
Ace Your Homework with AI
Get the answers you need in no time with our AI-driven, step-by-step assistance
Get Started
Financial Accounting and Reporting
Authors: Barry Elliott, Jamie Elliott
14th Edition
978-0273744535, 273744445, 273744534, 978-0273744443