

Question
The data are from a national sample of 6000 households with a male head of household and earnings of less than $15,000 annually in 1966.
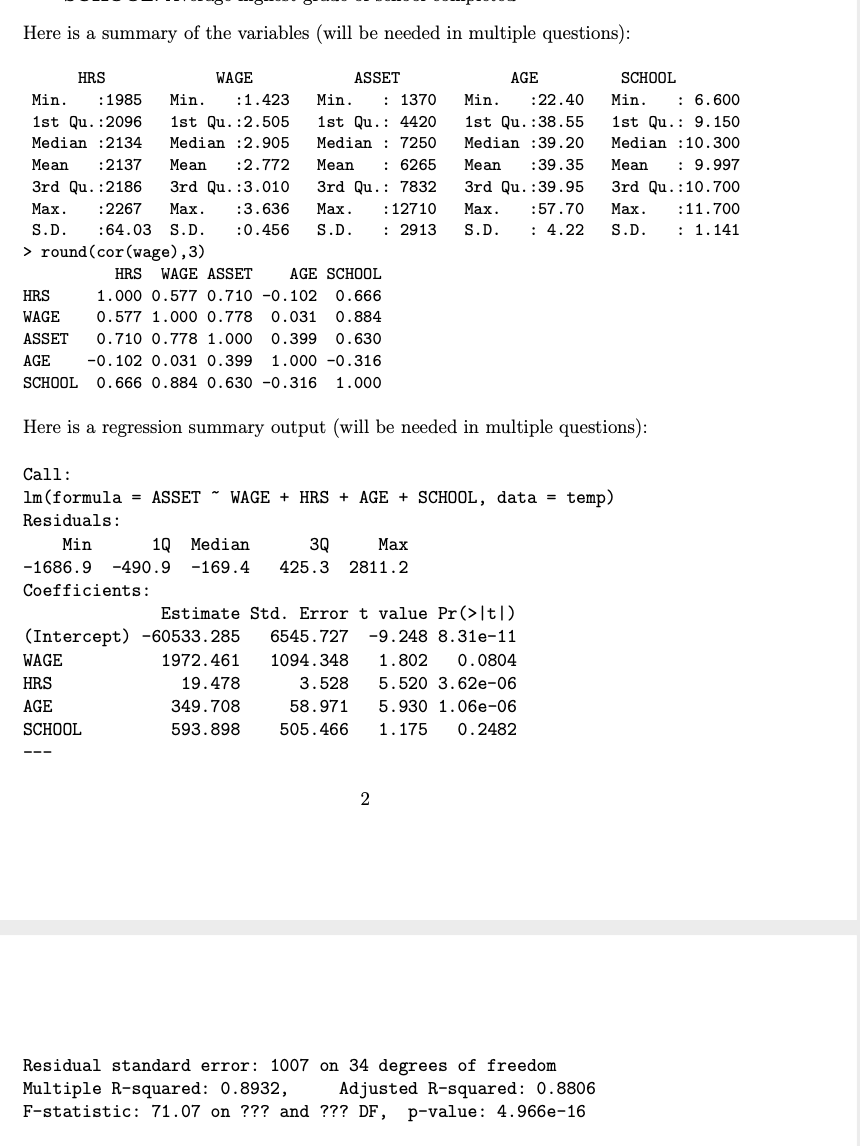
The data are from a national sample of 6000 households with a male head of household and earnings of less than $15,000 annually in 1966. Some demographic subgroups were formed for analysis of the relationship between average hours worked during the year and average hourly wages and other variables. Each data point represents one demographic subgroup.
The variables used were
? HRS: Average hours worked during the year (in hours) ? WAGE: Average hourly wage (in $) ? ASSET: Average family asset holdings (bank accounts, etc.) (in $) ? AGE: Average age of respondent (in years) ? SCHOOL: Average highest grade of school completed
Step by Step Solution
There are 3 Steps involved in it
Step: 1

Get Instant Access to Expert-Tailored Solutions
See step-by-step solutions with expert insights and AI powered tools for academic success
Step: 2

Step: 3
Ace Your Homework with AI
Get the answers you need in no time with our AI-driven, step-by-step assistance
Get Started