THE EXERCISE WILL BE ON FILE PLEASE I HAD TO TAKE MULTIPLE SCREENSHOT TO SHOW EVERYTHING
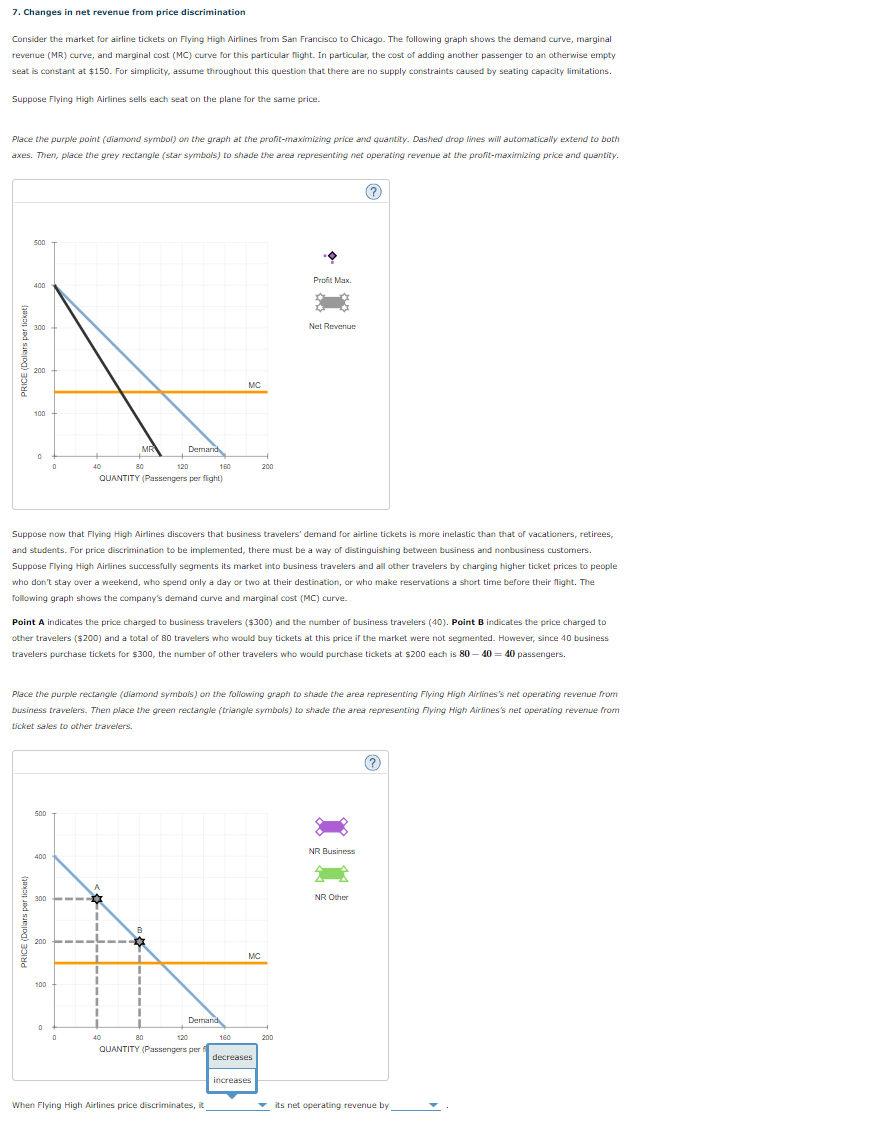
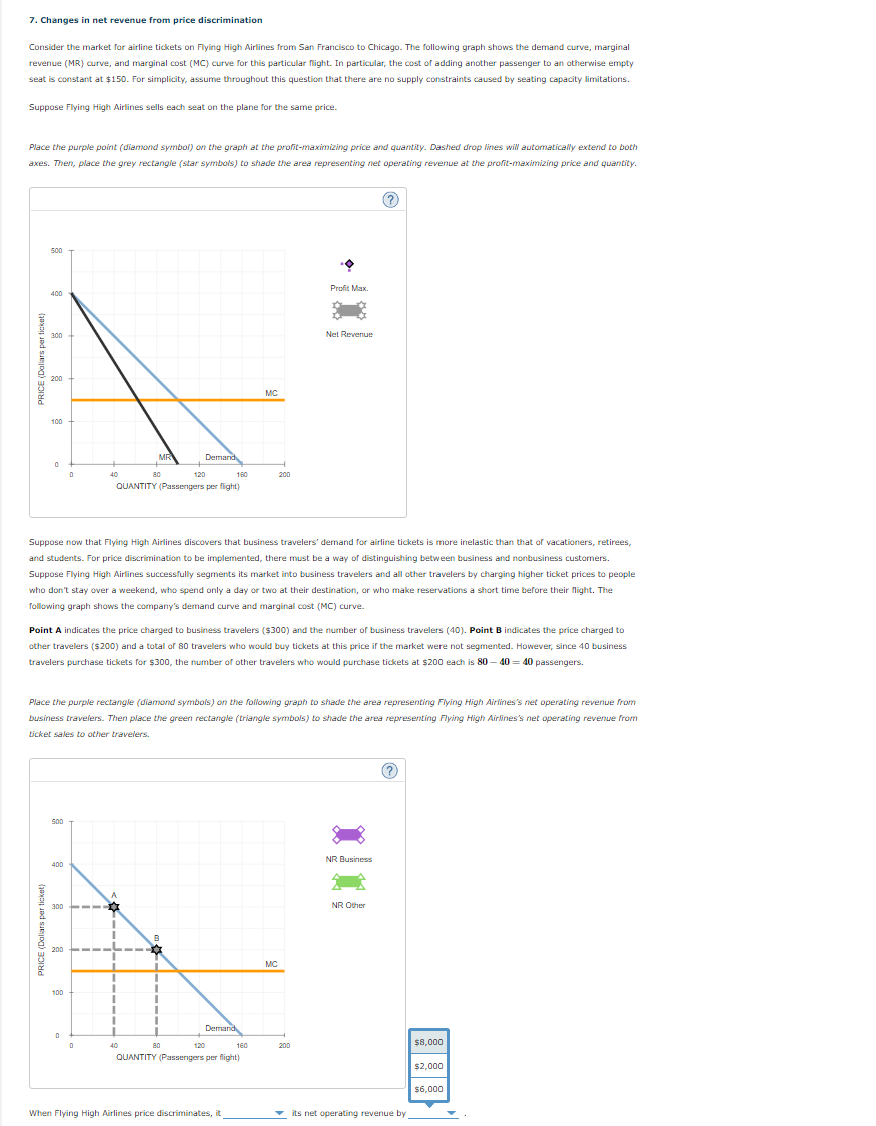
7. Changes in net revenue from price discrimination Consider the market for airline tickets on Flying High Airlines from San Francisco to Chicago. The following graph shows the demand curve, marginal revenue (MR) curve, and marginal cost (MC) curve for this particular flight. In particular, the cost of adding another passenger to an otherwise empty seat is constant at $150. For simplicity, assume throughout this question that there are no supply constraints caused by seating capacity limitations. Suppose Flying High Airlines sells each seat on the plane for the same price. Place the purple point ( diamond symbol) on the graph at the profit-maximizing price and quantity. Dashed drop lines will automatically extend to both axes. Then, place the grey rectangle (star symbols) to shade the area representing net operating revenue at the profit-maximizing price and quantity. (?) 500 400 Profit Max. PRICE (Dollars per ticket) 300 Net Revenue 200 MC 100 Demand 80 120 160 QUANTITY (Passengers per flight) Suppose now that Flying High Airlines discovers that business to avelers' demand for airline tickets is more inelastic than that of vacationers, retirees, and students. For price discrimi must be a way of distinguishing business customers. Suppose Flying High Ai travelers by charging higher ticket prices to people who don't stay over a weekend, who spend only a day or two at their destination, or who make reservations a short time before their flight. The following graph shows the company's de and marginal cost (MC) curve. Point A indicates the price charged to business travelers ($300) and the number of business travelers (40). Point B indicates the price charged to other travelers ($200) and a total of 80 travelers who would buy tickets at this price if the market were not segmented. However, since 40 business travelers purchase tickets for $300, the number of other travelers who would purchase tickets at $200 each is 80 - 40 = 40 passengers. Place the purple rectangle (diamond symbols) on the following graph to shade the area representing Flying High Airlines's net operating revenue from business travelers. Then place the green rectangle (triangle symbols) to shade the area representing Flying High Airlines's net operating revenue from ticket sales to other travelers. (?) 500 NR Business PRICE (Dollars per ticket) 300 NR Other 200 MC 100 80 120 160 QUANTITY (Passengers per decreases increase When Flying High Airlines price discriminates, it its net operating revenue by7. Changes in net revenue from price discrimination Consider the market for airline tickets on Flying High Airlines from San Francisco to Chicago. The following graph shows the demand curve, marginal revenue (MR) curve, and marginal cost (MC) curve for this particular flight. In particular, the cost of adding another passenger to an otherwise e seat is constant at $150. For simplicity, assume throughout this question that there are no supply constraints caused by seating capacity limitations. Suppose Flying High Airlines sells each seat on the plane for the same price. Place the purple point (diamond symbol) on the graph at the profit-maximizing price and quantity. Dashed drop lines will automatically extend to both axes. Then, place the grey rectangle (star symbols) to shade the area representing net operating revenue at the profit-maximizing price and quantity. (? 500 400 Profit Max. PRICE (Dollars per ticket 300 Jet Revenue MC 100 MR Demand 120 160 200 QUANTITY (Passengers per flight) Suppose now that Flying High Airlines discovers that business travelers' demand for airline tickets is more inelastic than that of vacationers, retirees, and students. For price usiness customers. Suppose Flying High Airlines successfully segments its market into business travelers and all other travelers by charging higher ticket prices to people who don't stay over a weekend, who spend only a day or two at their destination, or who make reservations a short time before their flight. The following graph shows t ginal cost (MC) curve. Point A indicates the price charged to business travelers ($300) and the number of business travelers (40). Point B indicates the price charged to other travelers ($200) and a total of 80 travelers who wo buy tickets at this price if the market were not segmented. However, since 40 business travelers purchase tickets for $300, the number of other travelers who would purchase tickets at $200 each is 80 - 40 = 40 passengers. Place the purple rectangle (diamond symbols) on the following graph to shade the area representing Flying High Airlines's net operating revenue from business travelers. Then place the green rectangle (triangle symbols) to shade the area representing Flying High Airlines's net operating revenue from ticket sales to other travelers. (?) 500 ADD JR Business PRICE (Dollars per ticket 300 NR Other 200 MC Demand AD 120 160 200 $8,000 QUANTITY (Passengers per flight) $2,000 $6,000 When Flying High Airlines price discriminates, it its net operating revenue by_