

Question
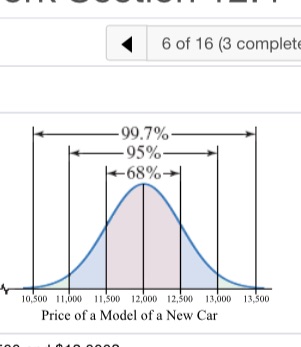
The figure illustrates a normal distribution for the prices paid for a particular model of a new car. The mean is $21,000 and the standard
The figure illustrates a normal distribution for the prices paid for a particular model of a new car. The mean is $21,000 and the standard deviation is $500. Use the 68-95-99.7 Rule to find the percentage of buyers who paid between $19,500 and $21,000.A graph has a horizontal axis labeled "Price of a Model of a New Car" from 19,500 to 22,500 in increments of 500 and a vertical axis labeled "Number of Car Buyers." A bell curve on the graph is centered at 21,000. The curve shows that approximately 68% fall between 20,500 and 21,500, approximately 95% fall between 20,000 and 22,000, and approximately 99.7% fall between 19,500 and 22,500.What percentage of buyers paid between $19,500 and $21,000?? ____?%
Step by Step Solution
There are 3 Steps involved in it
Step: 1

Get Instant Access to Expert-Tailored Solutions
See step-by-step solutions with expert insights and AI powered tools for academic success
Step: 2

Step: 3
Ace Your Homework with AI
Get the answers you need in no time with our AI-driven, step-by-step assistance
Get Started