

Question
The following financial information is for Sunland Company. (a1) Compute the liquidity and profitability ratios of Sunland Company for 2019 and 2020. (Round all answers
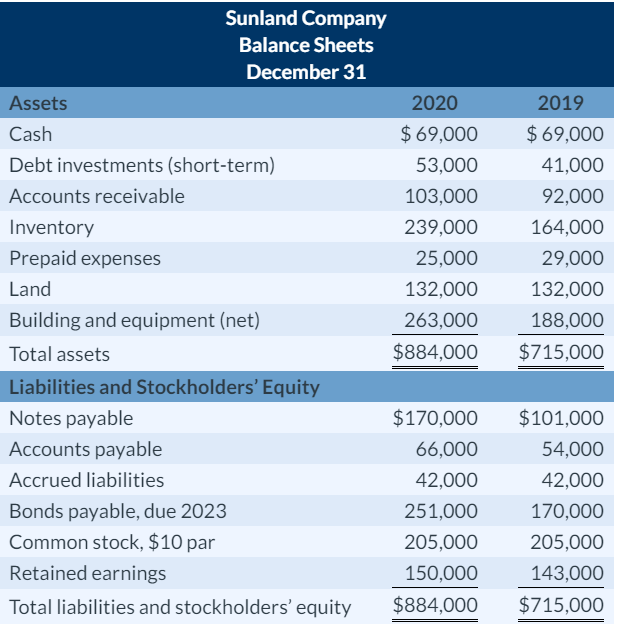
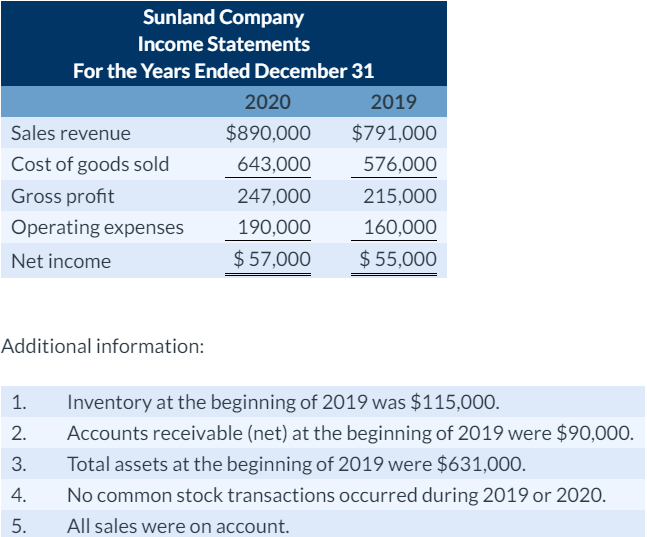
The following financial information is for Sunland Company.
(a1) Compute the liquidity and profitability ratios of Sunland Company for 2019 and 2020. (Round all answers to 2 decimal places, e.g. 1.83 or 1.83%. If % change is a decrease show the numbers as negative, e.g. -1.83% or (1.83%).) 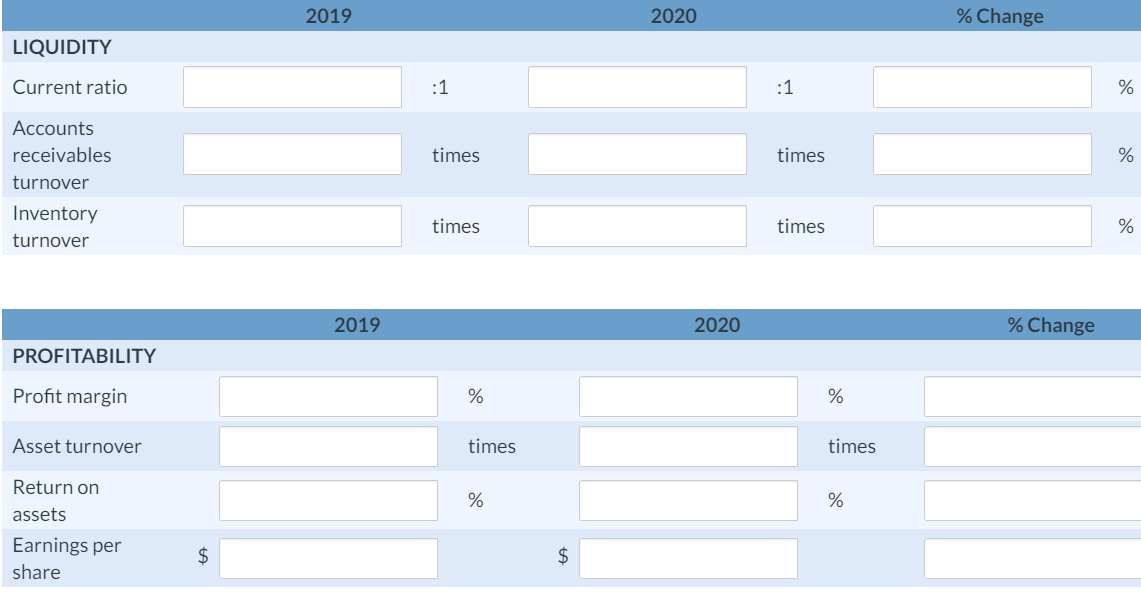
(b) The following are three independent situations and a ratio that may be affected. For each situation, compute the affected ratio (1) as of December 31, 2020, and (2) as of December 31, 2021, after giving effect to the situation. (Round all answers to 2 decimal places, e.g. 1.83 or 1.83%. If % change is a decrease show the numbers as negative, e.g. -1.83% or (1.83%).) 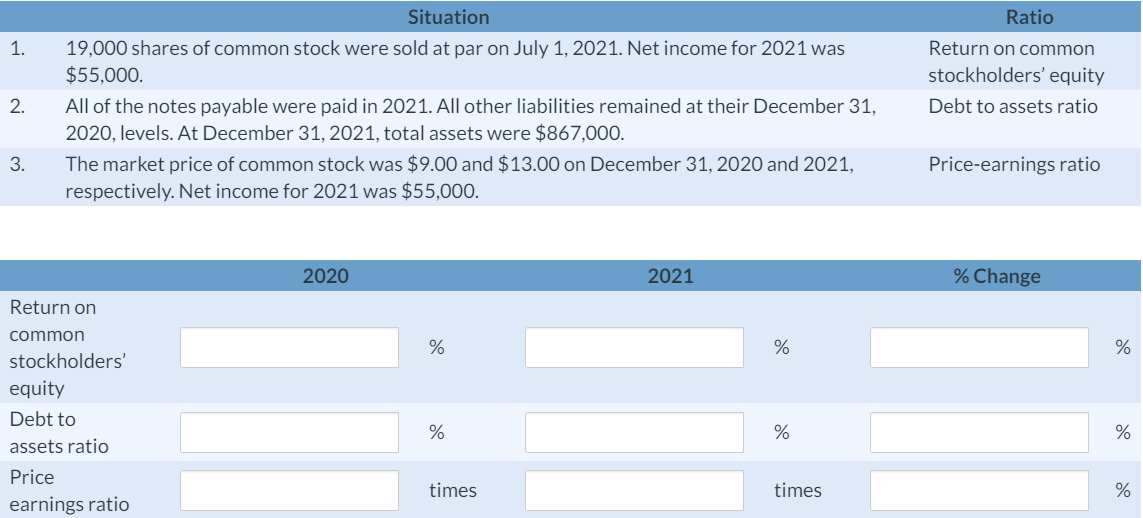
Step by Step Solution
There are 3 Steps involved in it
Step: 1

Get Instant Access to Expert-Tailored Solutions
See step-by-step solutions with expert insights and AI powered tools for academic success
Step: 2

Step: 3
Ace Your Homework with AI
Get the answers you need in no time with our AI-driven, step-by-step assistance
Get Started
From Zero To Zen Secret Keys To Nurturing Your Numbers And Finding Financial Flow
Authors: Liz Lajoie
1st Edition
1683507045, 978-1683507048