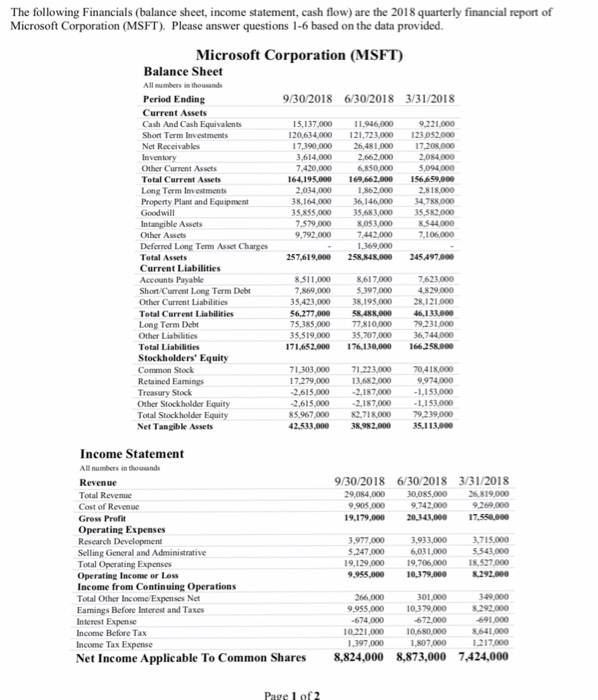
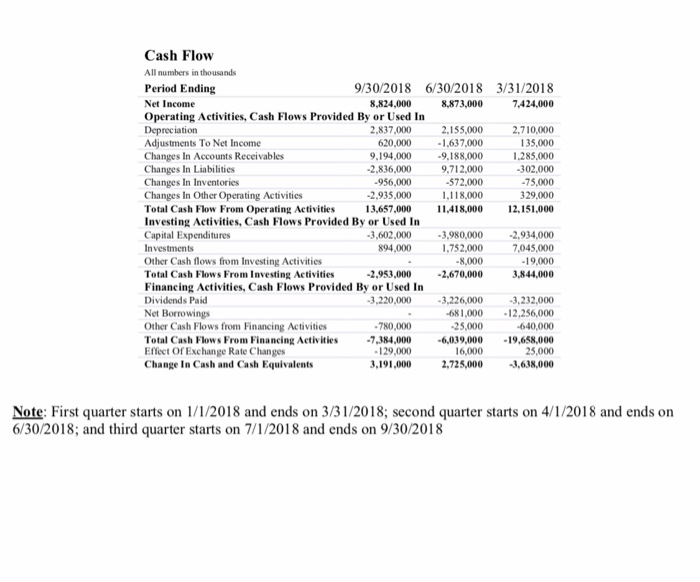
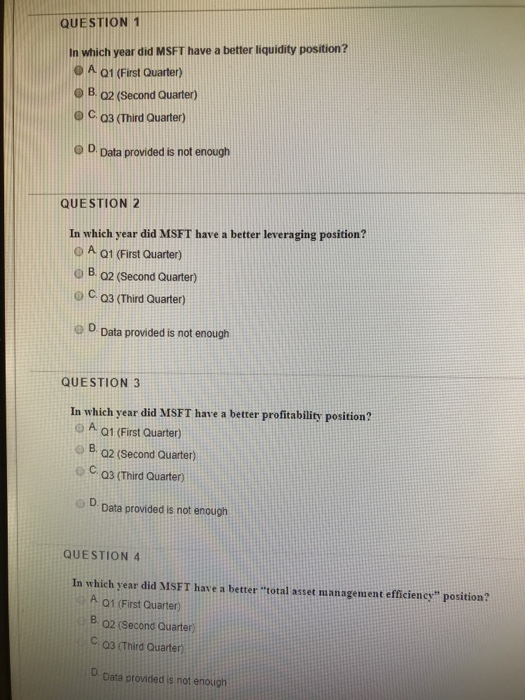
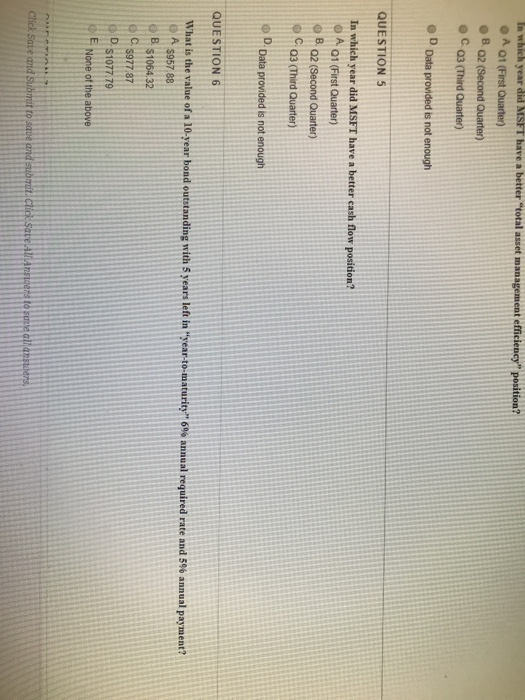
The following Financials (balance sheet, income statement, cash flow) are the 2018 quarterly financial report of Microsoft Corporation (MSFT). Please answer questions 1-6 based on the data provided. Microsoft Corporation (MSFT) Balance Sheet All numbers in thousands 9/30/2018 6/30/2018 3/31/2018 Property Plant and Equipment 71,303,000 71,223,000 70418,000 Equity Income Statement 9/30/2018 6/30/2018 3/31/2018 Income from Continuing Operations Total Other Income Expenses Net 7,424,000 8,873,000 8,824,000 Net Income Applicable To Common Shares Cash Flovw All numbers in thousands Period Ending Net Income Operating Activities, Cash Flows Provided By or Used In Depreciation Adjustments To Net Income 9/30/2018 6/30/2018 3/31/2018 8,824,000 8,873,000 7.424,000 2,837,000 2,155,000 2.710,000 35,000 9,194,000 9.188,0001.285,000 20,000 1,637,000 Changes In Accounts Receivables Changes In Liabilities 302.000 2,836,000 9.712.000 572,000 - 75,000 29,000 12,151,000 Changes In Inventories Changes In Other Operating Activities Total Cash Flow From Operating Activitie 3,657,000 11418,000 Investing Activities, Cash Flows Provided By or Used In Capital Expenditures Investments 956,000 2,935,000 1.118,000 3,602,000 3,980,000 2,934,000 894,0001,752,000 7,045,000 19,000 Other Cash flows from Investing Activities Total Cash Flows From Investing Activities Financing Activities, Cash Flows Provided By or Used In Dividends Paid Net Borrowings Other Cash Flows from Financing Activities Total Cash Flows From Financing Activities 7384,000 6,039,000 Effect Of Exchange Rate Changes Change In Cash and Cash Equivalents 8,000 2,953,000 2,670,0003,844,000 3,220,000 3,226,000 3,232,000 681,000 12,256,000 640,000 -19,658,000 25,000 ,191,000 2,725,000 3,638,000 780,000 25,000 129,000 6,000 Note: First quarter starts on 1/1/2018 and ends on 3/31/2018; second quarter starts on 4/1/2018 and ends on 6/30/2018; and third quarter starts on 7/1/2018 and ends on 9/30/2018 9 QUESTION1 In which year did MSFT have a better liquidity position? O A Q1 (First Quarter) B. Q2 (Second Quarter) O C a3 (Third Quarter) D. Data provided is not enough QUESTION 2 In which year did MSFT have a better leveraging position? O A 01 (First Quarter) 0 B. 02 (Second Quarter) (Third Quarter) O D Data provided is not enough QUESTION 3 In which year did MSFT have a better profitability position? O A a1 (First Quarter) B. Q2 (Second Quarter) C. Q3 (Third Quarter) O D Data provided is not enough QUESTION 4 In which year did MSFT have a better 'total asset management efficiene" position? A 01 (First Quarter) B 02 (Second Quarter) C 03 (Third Quarter) 0 Data provided is not enough OB. 02 (Second Quarter) e C a3 (Third Quarter QUESTION 5 O A Q1 (First Quarter) o B a2 (Second Quarter) o c. Q3 (Third Quarter) D. Data QUESTION 6 OA $957.88 B. S106432 () C. S977.87 D s1077.79 None of the above The following Financials (balance sheet, income statement, cash flow) are the 2018 quarterly financial report of Microsoft Corporation (MSFT). Please answer questions 1-6 based on the data provided. Microsoft Corporation (MSFT) Balance Sheet All numbers in thousands 9/30/2018 6/30/2018 3/31/2018 Property Plant and Equipment 71,303,000 71,223,000 70418,000 Equity Income Statement 9/30/2018 6/30/2018 3/31/2018 Income from Continuing Operations Total Other Income Expenses Net 7,424,000 8,873,000 8,824,000 Net Income Applicable To Common Shares Cash Flovw All numbers in thousands Period Ending Net Income Operating Activities, Cash Flows Provided By or Used In Depreciation Adjustments To Net Income 9/30/2018 6/30/2018 3/31/2018 8,824,000 8,873,000 7.424,000 2,837,000 2,155,000 2.710,000 35,000 9,194,000 9.188,0001.285,000 20,000 1,637,000 Changes In Accounts Receivables Changes In Liabilities 302.000 2,836,000 9.712.000 572,000 - 75,000 29,000 12,151,000 Changes In Inventories Changes In Other Operating Activities Total Cash Flow From Operating Activitie 3,657,000 11418,000 Investing Activities, Cash Flows Provided By or Used In Capital Expenditures Investments 956,000 2,935,000 1.118,000 3,602,000 3,980,000 2,934,000 894,0001,752,000 7,045,000 19,000 Other Cash flows from Investing Activities Total Cash Flows From Investing Activities Financing Activities, Cash Flows Provided By or Used In Dividends Paid Net Borrowings Other Cash Flows from Financing Activities Total Cash Flows From Financing Activities 7384,000 6,039,000 Effect Of Exchange Rate Changes Change In Cash and Cash Equivalents 8,000 2,953,000 2,670,0003,844,000 3,220,000 3,226,000 3,232,000 681,000 12,256,000 640,000 -19,658,000 25,000 ,191,000 2,725,000 3,638,000 780,000 25,000 129,000 6,000 Note: First quarter starts on 1/1/2018 and ends on 3/31/2018; second quarter starts on 4/1/2018 and ends on 6/30/2018; and third quarter starts on 7/1/2018 and ends on 9/30/2018 9 QUESTION1 In which year did MSFT have a better liquidity position? O A Q1 (First Quarter) B. Q2 (Second Quarter) O C a3 (Third Quarter) D. Data provided is not enough QUESTION 2 In which year did MSFT have a better leveraging position? O A 01 (First Quarter) 0 B. 02 (Second Quarter) (Third Quarter) O D Data provided is not enough QUESTION 3 In which year did MSFT have a better profitability position? O A a1 (First Quarter) B. Q2 (Second Quarter) C. Q3 (Third Quarter) O D Data provided is not enough QUESTION 4 In which year did MSFT have a better 'total asset management efficiene" position? A 01 (First Quarter) B 02 (Second Quarter) C 03 (Third Quarter) 0 Data provided is not enough OB. 02 (Second Quarter) e C a3 (Third Quarter QUESTION 5 O A Q1 (First Quarter) o B a2 (Second Quarter) o c. Q3 (Third Quarter) D. Data QUESTION 6 OA $957.88 B. S106432 () C. S977.87 D s1077.79 None of the above


