Answered step by step
Verified Expert Solution
Question
1 Approved Answer
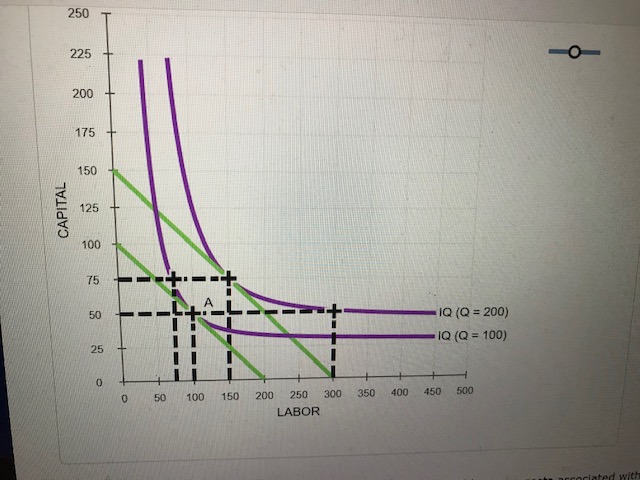
The following graph shows isoquants for the technologically efficient bundles of labor and capital for producing 100 and 200 units of output (labeledIQ(Q=100)andIQ(Q=200) , respectively).
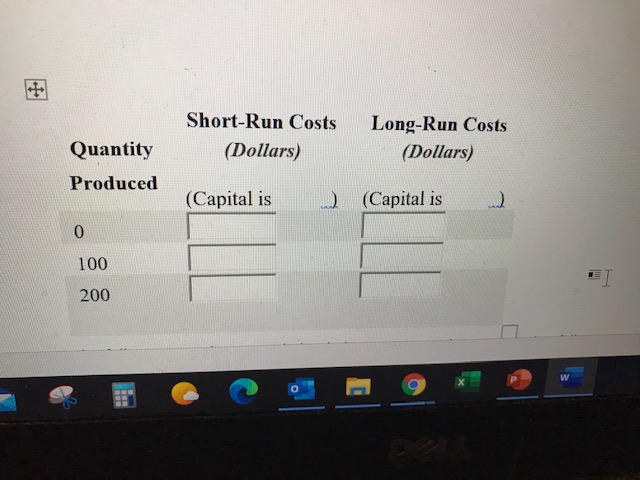
The following graph shows isoquants for the technologically efficient bundles of labor and capital for producing 100 and 200 units of output (labeledIQ(Q=100)andIQ(Q=200) , respectively). Suppose the firm is initially using the cost-minimizing bundle of labor and capital for producing 100 units of output, represented by point A.
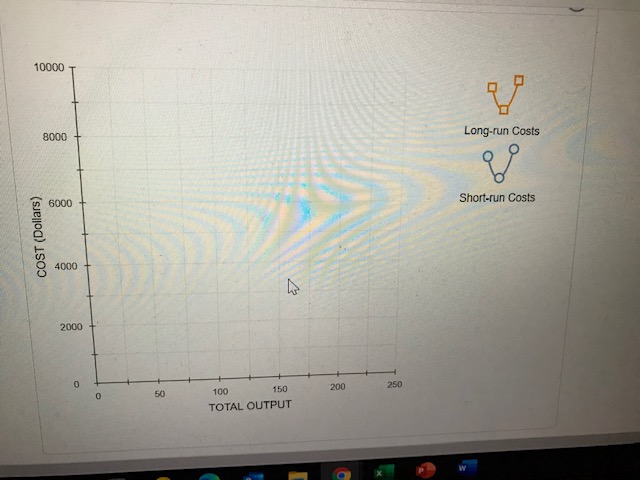
Assume that the expansion path is a straight line in this case. Use the blue line (circle symbols) to show the expansion path for this firm on the graph.
Graph: See Graph below.


Step by Step Solution
There are 3 Steps involved in it
Step: 1

Get Instant Access to Expert-Tailored Solutions
See step-by-step solutions with expert insights and AI powered tools for academic success
Step: 2

Step: 3

Ace Your Homework with AI
Get the answers you need in no time with our AI-driven, step-by-step assistance
Get Started


