Answered step by step
Verified Expert Solution
Link Copied!

Question

1 Approved Answer

The following graph shows two forecasts produced from two different values of alpha and beta for the exponential smoothing with trend method. 10 1 7
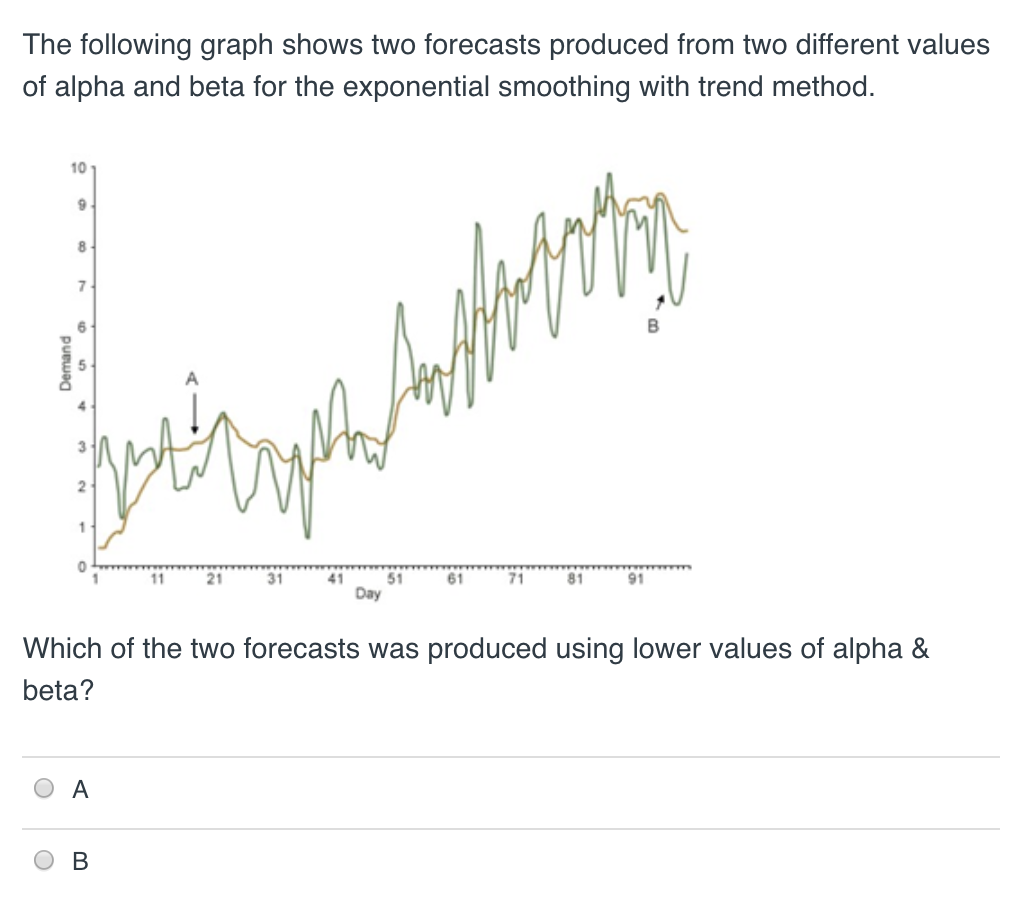
image text in transcribed

The following graph shows two forecasts produced from two different values of alpha and beta for the exponential smoothing with trend method. 10 1 7 8 5 111 21 31 41 51 61 71 81 91 Day Which of the two forecasts was produced using lower values of alpha & beta? O A O B

Step by Step Solution

There are 3 Steps involved in it

Step: 1

blur-text-image

Get Instant Access to Expert-Tailored Solutions

See step-by-step solutions with expert insights and AI powered tools for academic success

Step: 2

blur-text-image_2

Step: 3

blur-text-image_3

Ace Your Homework with AI

Get the answers you need in no time with our AI-driven, step-by-step assistance

Get Started

Recommended Textbook for

Beginners Swing Trading Bible

Authors: Joe Dichristophoro

1st Edition

154241735X, 978-1542417358

More Books

Students also viewed these Finance questions

Question

=+ Do you see any stable relationships in the data?

Answered: 1 week ago