

Answered step by step
Verified Expert Solution
Question
1 Approved Answer
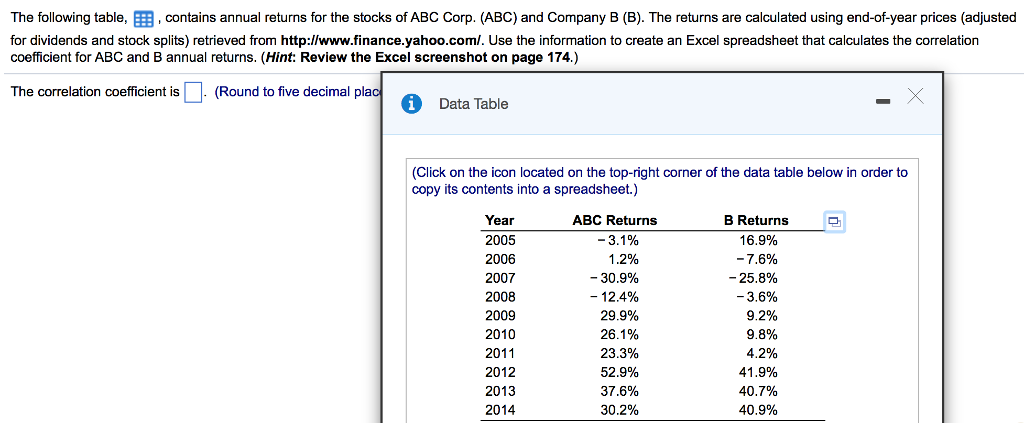
The following table,, contains annual returns for the stocks of ABC Corp. (ABC) and Company B (B). The returns are calculated using end-of-year prices (adjusted
Step by Step Solution
There are 3 Steps involved in it
Step: 1

Get Instant Access to Expert-Tailored Solutions
See step-by-step solutions with expert insights and AI powered tools for academic success
Step: 2

Step: 3
Ace Your Homework with AI
Get the answers you need in no time with our AI-driven, step-by-step assistance
Get Started
Sunday Times Book Of Personal Finance
Authors: Diana Wright
1st Edition
0715391119, 9780715391112