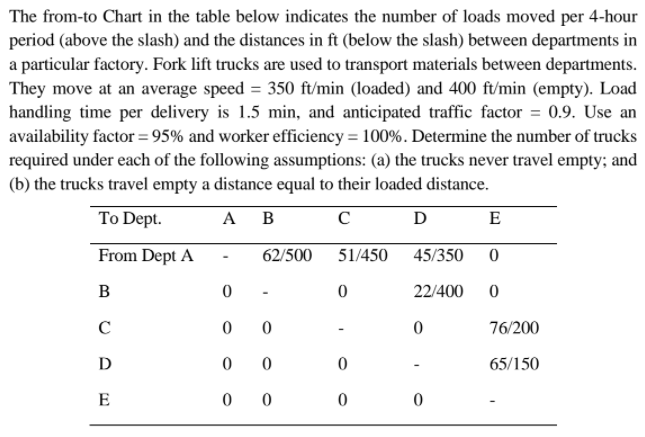
Question: The from-to Chart in the table below indicates the number of loads moved per 4-hour period (above the slash) and the distances in ft (below

The from-to Chart in the table below indicates

The from-to Chart in the table below indicates the number of loads moved per 4-hour period (above the slash) and the distances in ft (below the slash) between departments in a particular factory. Fork lift trucks are used to transport materials between departments. They move at an average speed = 350 ft/min (loaded) and 400 ft/min (empty). Load handling time per delivery is 1.5 min, and anticipated traffic factor = 0.9. Use an availability factor = 95% and worker efficiency = 100%. Determine the number of trucks required under each of the following assumptions: (a) the trucks never travel empty; and (b) the trucks travel empty a distance equal to their loaded distance. To Dept. D E From Dept A 62/500 51/450 45/350 0 B 0 0 22/400 0 0 0 0 76/200 D 0 0 0 65/150 E 0 0 0 0

Step by Step Solution

There are 3 Steps involved in it

1 Expert Approved Answer
Step: 1 Unlock blur-text-image
Question Has Been Solved by an Expert!

Get step-by-step solutions from verified subject matter experts

Step: 2 Unlock
Step: 3 Unlock

Students Have Also Explored These Related General Management Questions!