Question
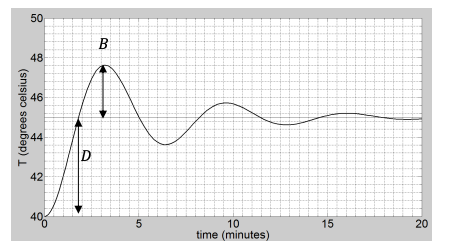
The graph here is the response of an outlet temperature to a step increase of 10 lbm/min of steam flow through a jacket. Answer the
The graph here is the response of an outlet temperature to a step increase of 10 lbm/min of steam flow through a jacket. Answer the following questions regarding this system. (a) Is the system stable? How do you know? (b) What type of damping is displayed? (over-, under-, critically-, etc)
(c) indicate the relevant parts on the graph, then use the readings from the graph to determine values of the following (including units where needed!): (i) Overshoot (Relevant parts of the graph done as an example for you already) (ii) Decay ratio (iii) Rise time (iv) Period
(d) From readings on the graph, calculate: (i) Process gain (ii) Damping factor (iii) Natural period

Step by Step Solution
There are 3 Steps involved in it
Step: 1

Get Instant Access to Expert-Tailored Solutions
See step-by-step solutions with expert insights and AI powered tools for academic success
Step: 2

Step: 3

Ace Your Homework with AI
Get the answers you need in no time with our AI-driven, step-by-step assistance
Get Started


