

Answered step by step
Verified Expert Solution
Question
1 Approved Answer
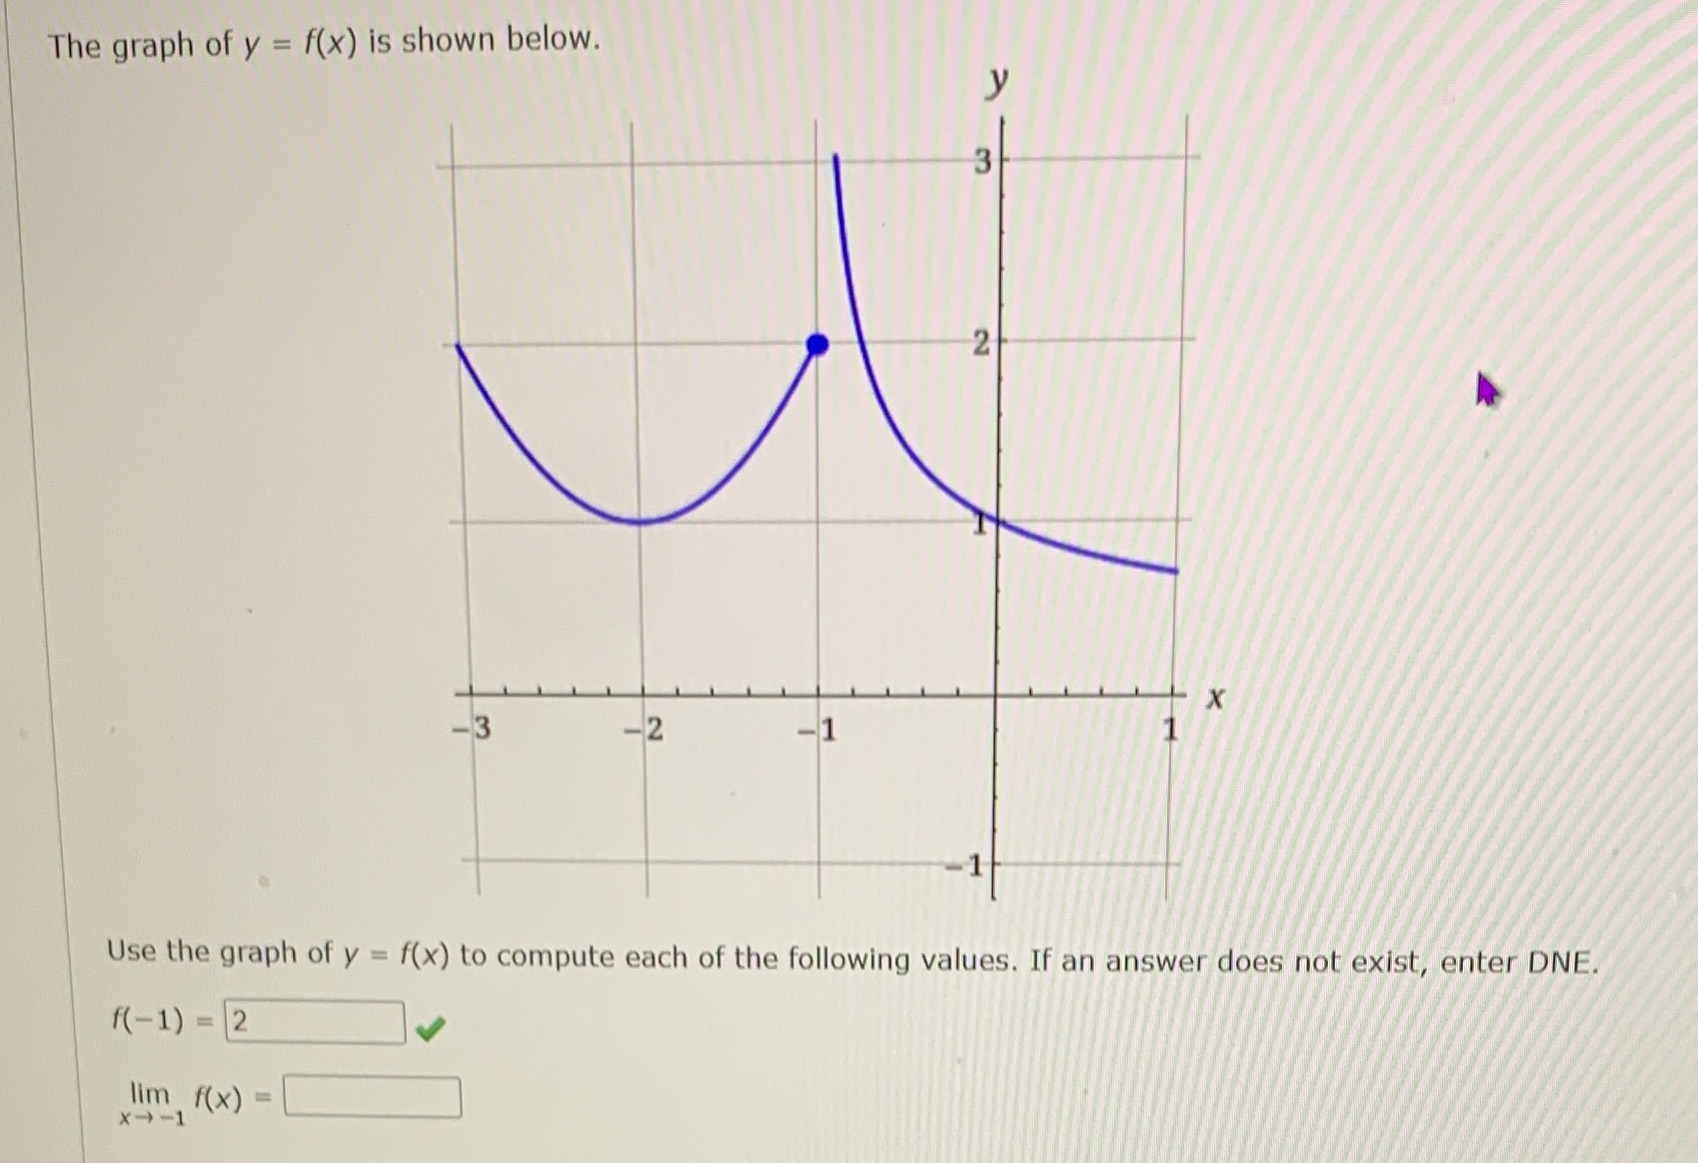
The graph of y = f(x) is shown below. 2 X -3 -2 Use the graph of y = f(x) to compute each of the
Step by Step Solution
There are 3 Steps involved in it
Step: 1

Get Instant Access to Expert-Tailored Solutions
See step-by-step solutions with expert insights and AI powered tools for academic success
Step: 2

Step: 3
Ace Your Homework with AI
Get the answers you need in no time with our AI-driven, step-by-step assistance
Get Started
Calculus Early Transcendentals Early Transcendentals
Authors: Dennis G Zill, Warren S Wright
4th Edition
0763797375, 9780763797379