Answered step by step
Verified Expert Solution
Question
1 Approved Answer
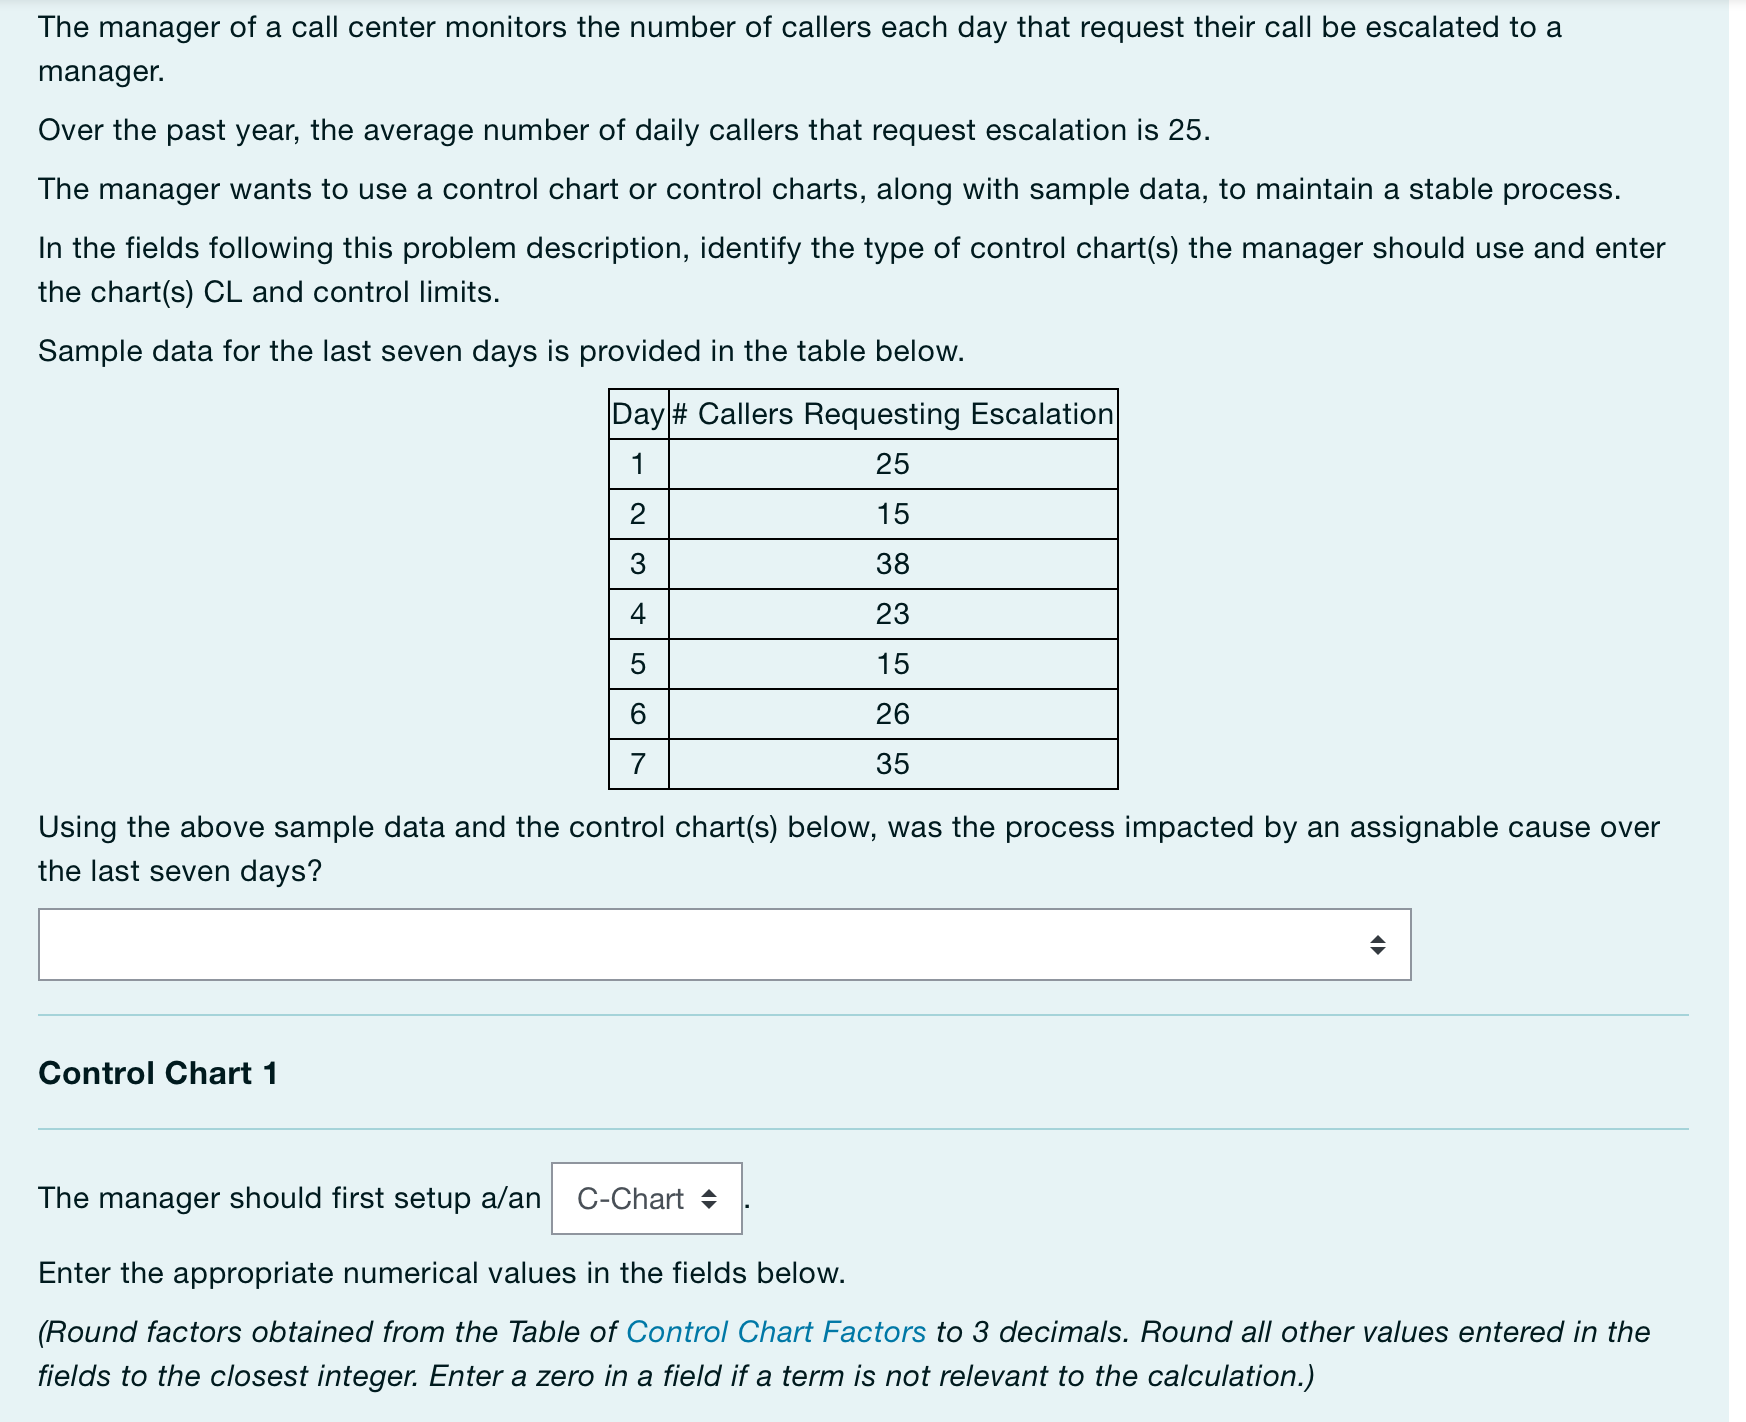
The manager of a call center monitors the number of callers each day that request their call be escalated to a manager. Over the past


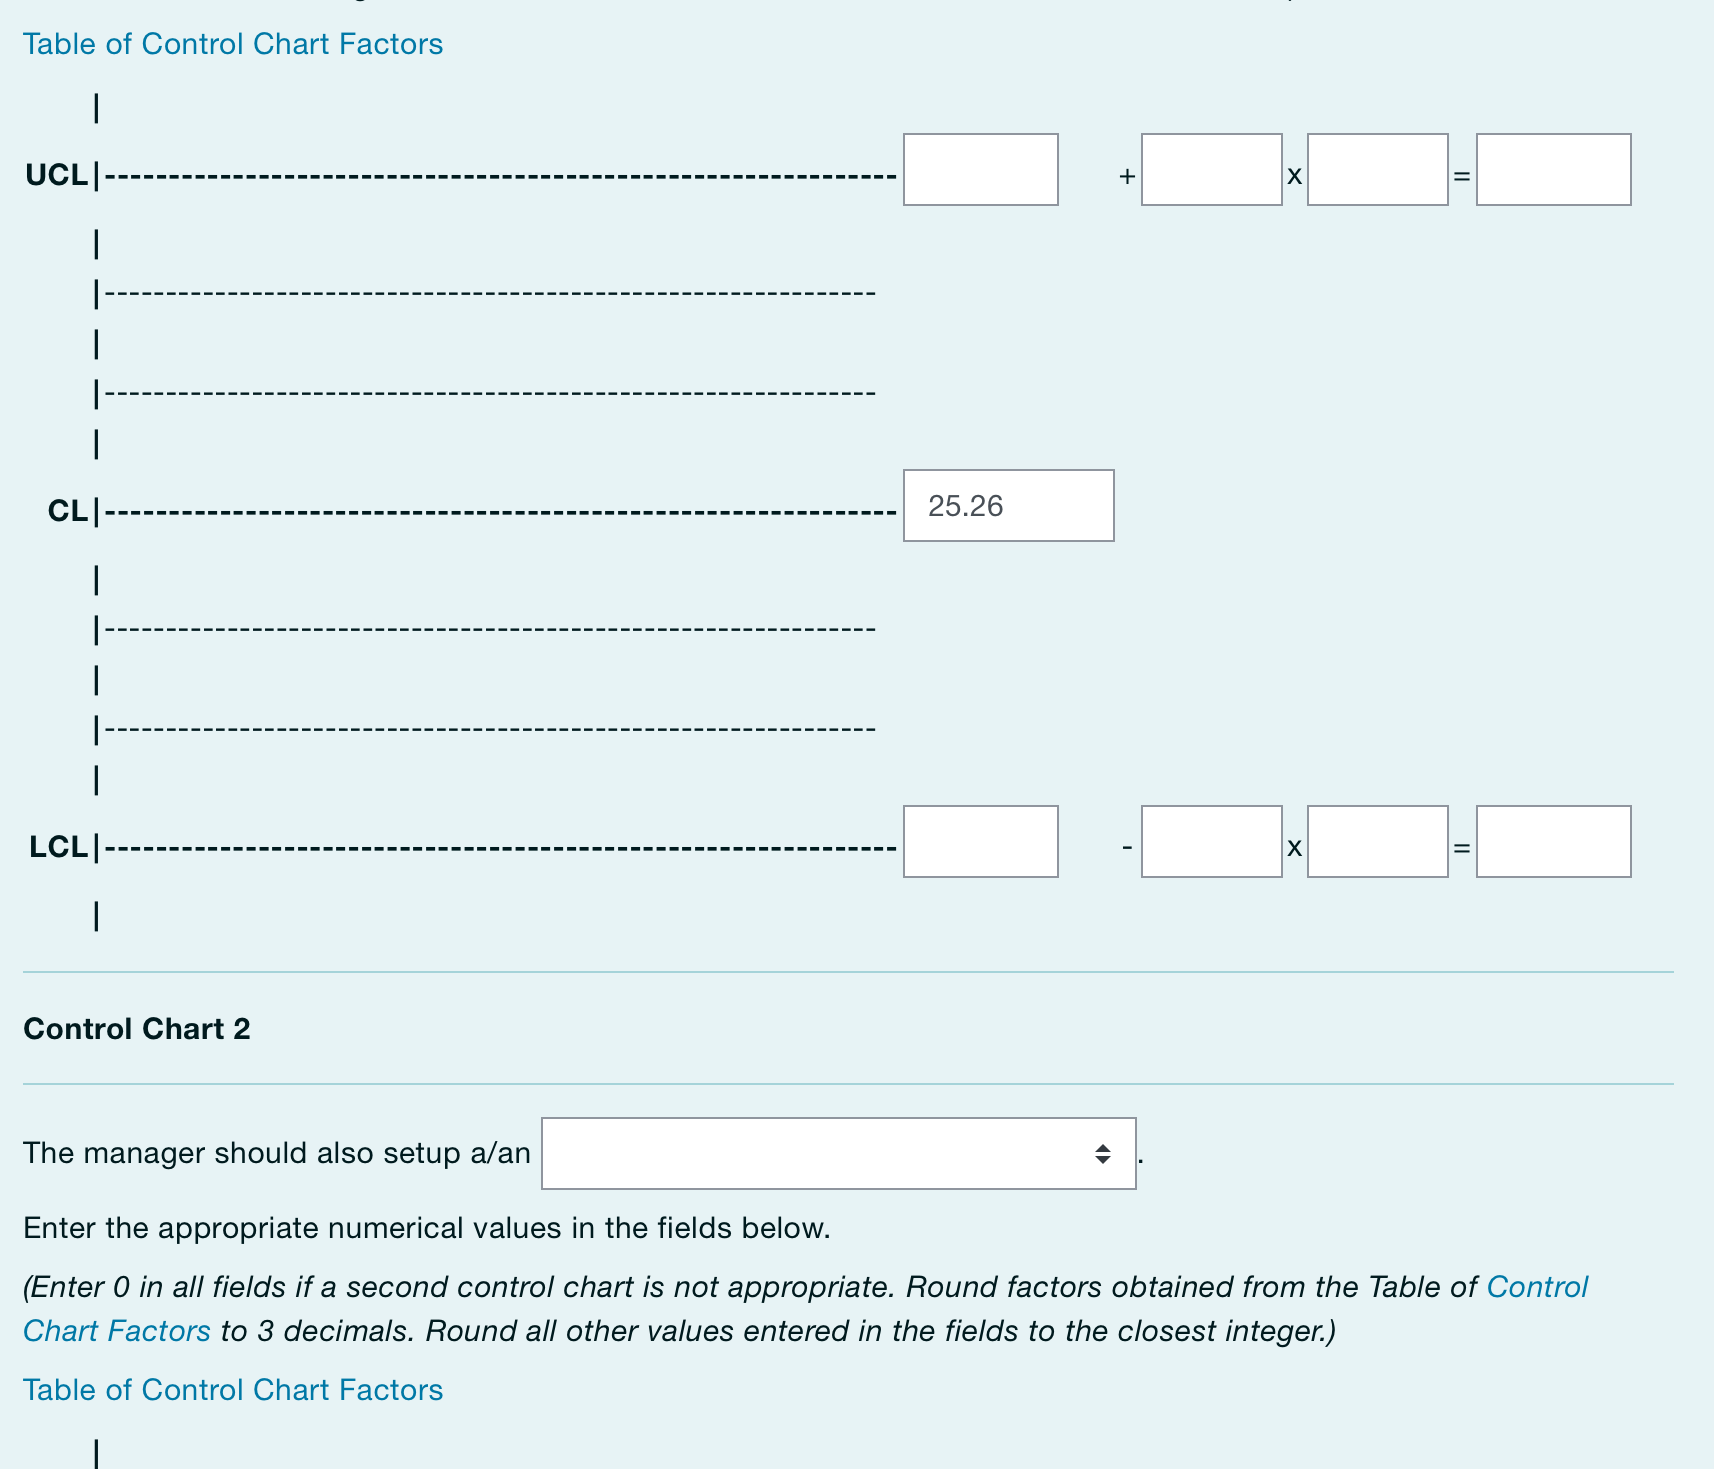
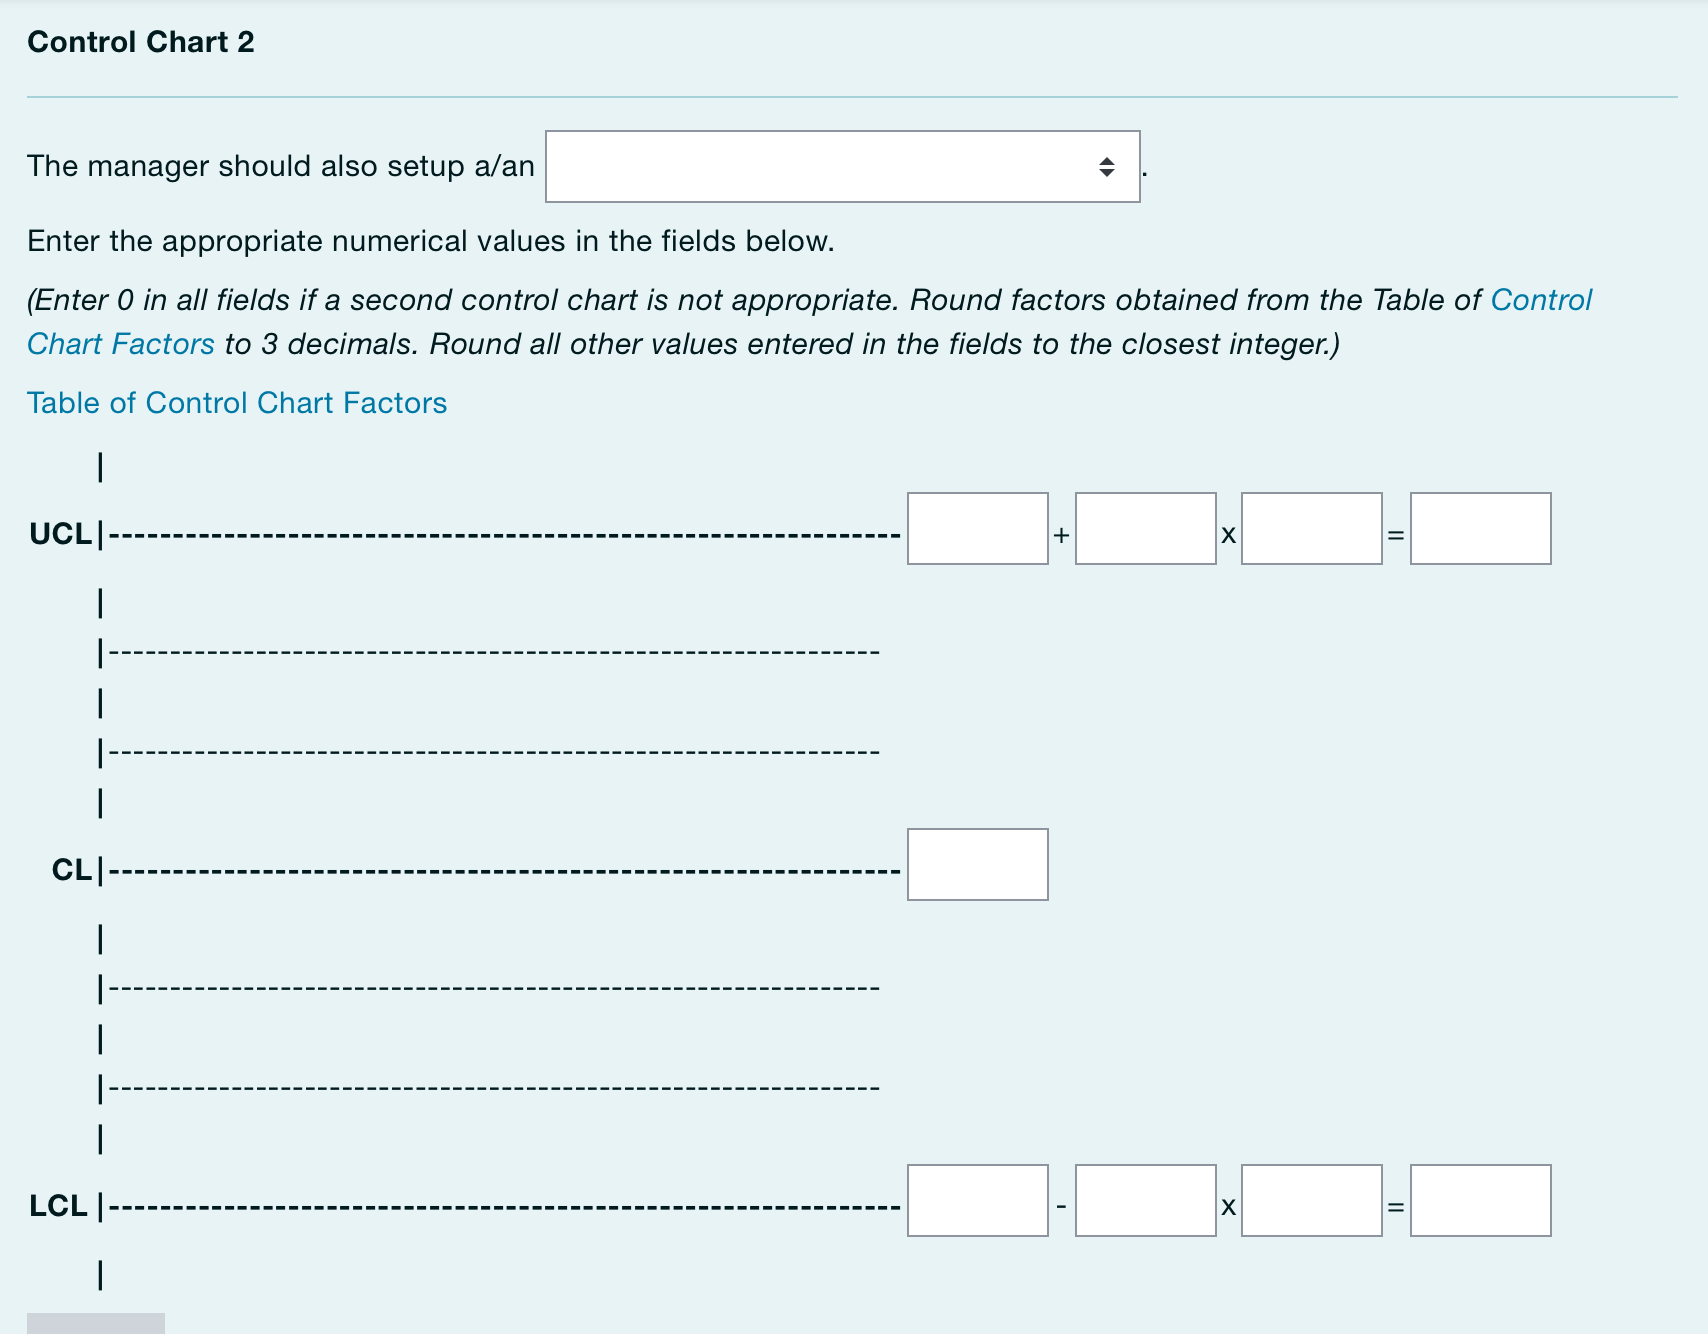
 The manager of a call center monitors the number of callers each day that request their call be escalated to a manager. Over the past year, the average number of daily callers that request escalation is 25 . The manager wants to use a control chart or control charts, along with sample data, to maintain a stable process. In the fields following this problem description, identify the type of control chart(s) the manager should use and enter the chart(s) CL and control limits. Sample data for the last seven days is provided in the table below. Using the above sample data and the control chart(s) below, was the process impacted by an assignable cause over the last seven days? Control Chart 1 The manager should first setup a/an Enter the appropriate numerical values in the fields below. (Round factors obtained from the Table of Control Chart Factors to 3 decimals. Round all other values entered in the fields to the closest integer. Enter a zero in a field if a term is not relevant to the calculation.) The manager should also setup a/an Enter the appropriate numerical values in the fields below. (Enter 0 in all fields if a second control chart is not appropriate. Round factors obtained from the Table of Control Chart Factors to 3 decimals. Round all other values entered in the fields to the closest integer.) Table of Control Chart Factors The manager should also setup a/an Enter the appropriate numerical values in the fields below. (Enter 0 in all fields if a second control chart is not appropriate. Round factors obtained from the Table of Control Chart Factors to 3 decimals. Round all other values entered in the fields to the closest integer.) Table of Control Chart Factors The manager of a call center monitors the number of callers each day that request their call be escalated to a manager. Over the past year, the average number of daily callers that request escalation is 25 . The manager wants to use a control chart or control charts, along with sample data, to maintain a stable process. In the fields following this problem description, identify the type of control chart(s) the manager should use and enter the chart(s) CL and control limits. Sample data for the last seven days is provided in the table below. Using the above sample data and the control chart(s) below, was the process impacted by an assignable cause over the last seven days? Control Chart 1 The manager should first setup a/an Enter the appropriate numerical values in the fields below. (Round factors obtained from the Table of Control Chart Factors to 3 decimals. Round all other values entered in the fields to the closest integer. Enter a zero in a field if a term is not relevant to the calculation.) The manager should also setup a/an Enter the appropriate numerical values in the fields below. (Enter 0 in all fields if a second control chart is not appropriate. Round factors obtained from the Table of Control Chart Factors to 3 decimals. Round all other values entered in the fields to the closest integer.) Table of Control Chart Factors The manager should also setup a/an Enter the appropriate numerical values in the fields below. (Enter 0 in all fields if a second control chart is not appropriate. Round factors obtained from the Table of Control Chart Factors to 3 decimals. Round all other values entered in the fields to the closest integer.) Table of Control Chart Factors
 Step by Step Solution
There are 3 Steps involved in it
Step: 1

Get Instant Access to Expert-Tailored Solutions
See step-by-step solutions with expert insights and AI powered tools for academic success
Step: 2

Step: 3

Ace Your Homework with AI
Get the answers you need in no time with our AI-driven, step-by-step assistance
Get Started


