Answered step by step
Verified Expert Solution
Link Copied!

Question

1 Approved Answer

The number shown next to each link of the network in the figure below is the probability of the link failing during the lifetime of
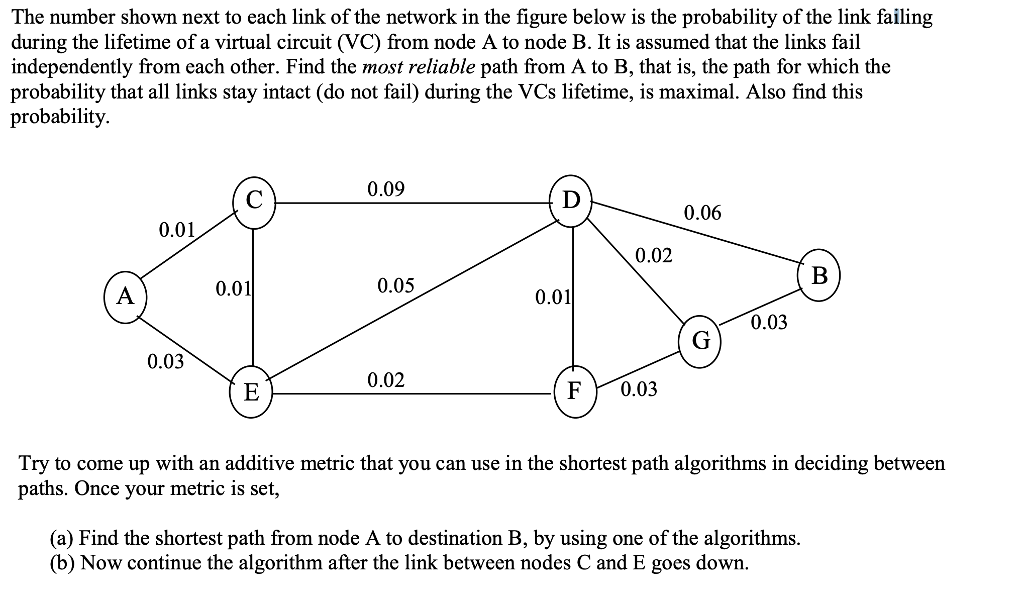
image text in transcribed

The number shown next to each link of the network in the figure below is the probability of the link failing during the lifetime of a virtual circuit (VC) from node A to node B. It is assumed that the links fail independently from each other. Find the most reliable path from A to B, that is, the path for which the probability that all links stay intact (do not fail) during the VCs lifetime, is maximal. Also find this probability 0.09 0.06 0.01 0.02 0.01 0.05 0.01 0.03 0.03 0.02 F0.03 Try to come up with an additive metric that you can use in the shortest path algorithms in deciding between paths. Once your metric is set, (a) Find the shortest path from node A to destination B, by using one of the algorithms. (b) Now continue the algorithm after the link between nodes C and E goes down

Step by Step Solution

There are 3 Steps involved in it

Step: 1

blur-text-image

Get Instant Access to Expert-Tailored Solutions

See step-by-step solutions with expert insights and AI powered tools for academic success

Step: 2

blur-text-image_2

Step: 3

blur-text-image_3

Ace Your Homework with AI

Get the answers you need in no time with our AI-driven, step-by-step assistance

Get Started

Recommended Textbook for

Understanding Oracle APEX 5 Application Development

Authors: Edward Sciore

2nd Edition

1484209893, 9781484209899

More Books

Students also viewed these Databases questions