Answered step by step
Verified Expert Solution
Question
1 Approved Answer
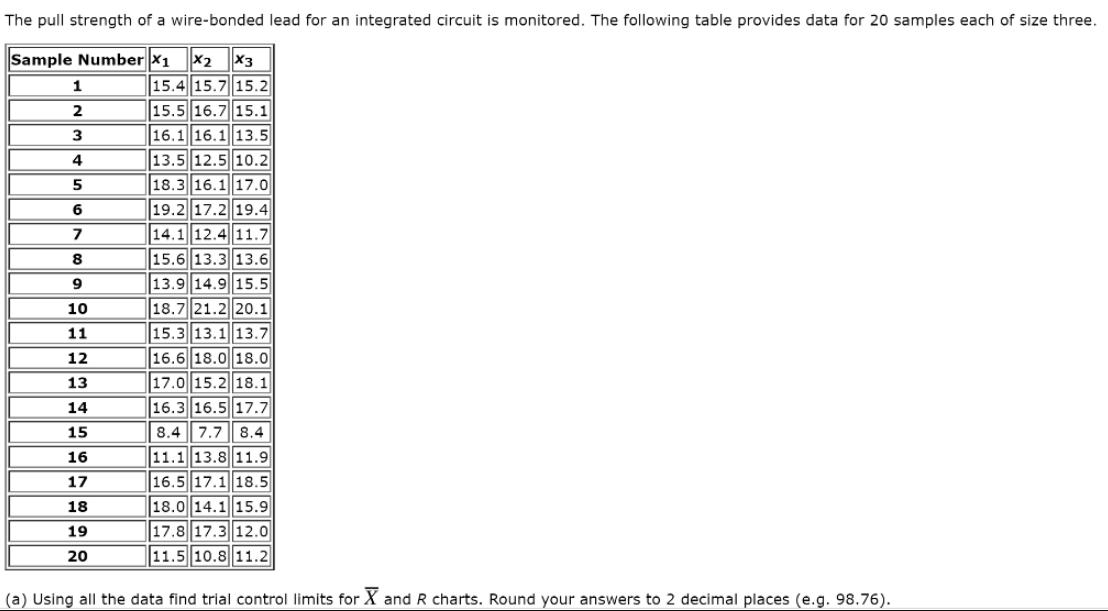
The pull strength of a wire-bonded lead for an integrated circuit is monitored. The following table provides data for 20 samples each of size


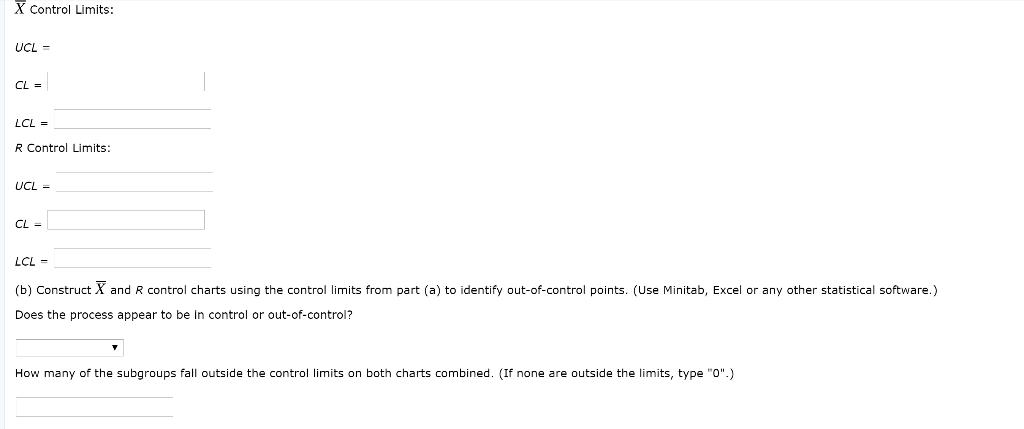
The pull strength of a wire-bonded lead for an integrated circuit is monitored. The following table provides data for 20 samples each of size three. Sample Number x1 X2 X3 15.4 15.7 15.2 15.5 16.7 15.1 16.1 16.1 13.5 1 3 13.5 12.5 10.2 18.3 16.1 17.0 19.2 17.2 19.4 14.1 12.4| 11.7 15.6 13.3 13.6 13.9 14.9 15.5 18.7 21.2 20.1 4 5 7 8 9 10 15.3 13.1 13.7 16.6 18.0 18.0 11 12 13 17.0 15.2 18.1 16.3 16.5 17.7 8.4 7.7 8.4 14 15 11.1 13.8 11.9 16.5 17.1 18.5 16 17 18 18.0 14.1 15.9 19 17.8 17.312.0 20 11.5 10.8 11.2 (a) Using all the data find trial control limits for X and R charts. Round your answers to 2 decimal places (e.g. 98.76). X Control Limits: UCL - CL = LCL = R Control Limits: UCL = CL = LCL - (b) Construct X and R control charts using the control limits from part (a) to identify out-of-control points. (Use Minitab, Excel or any other statistical software.) Does the process appear to be in control or out-of-control? How many of the subgroups fall outside the control limits on both charts combined. (If none are outside the limits, type "0".)
Step by Step Solution
There are 3 Steps involved in it
Step: 1
1 Control limits for R Chart Where R 3D axx inX CL R n UCL DR LCL ...
Get Instant Access to Expert-Tailored Solutions
See step-by-step solutions with expert insights and AI powered tools for academic success
Step: 2

Step: 3

Ace Your Homework with AI
Get the answers you need in no time with our AI-driven, step-by-step assistance
Get Started


