Answered step by step
Verified Expert Solution
Link Copied!

Question

1 Approved Answer

The Quantity is represented along the horizontal axis. The Price and cost in U 8 dollars per unit is represented along the vertical axis, and
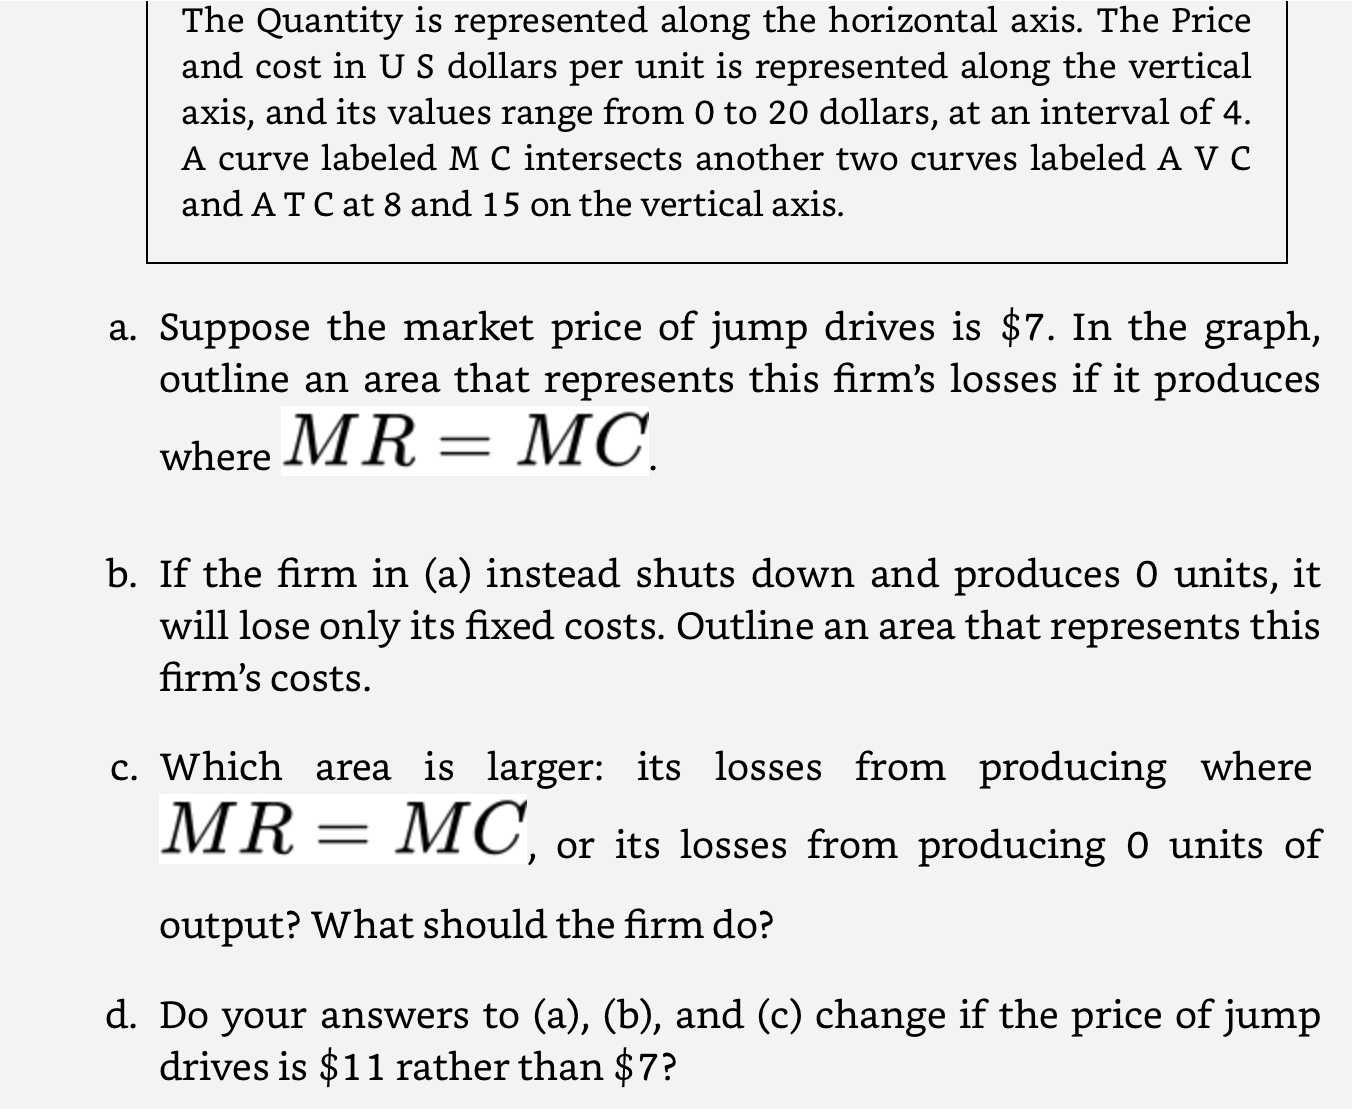
image text in transcribed
The Quantity is represented along the horizontal axis. The Price and cost in U 8 dollars per unit is represented along the vertical axis, and its values range from 0 to 20 dollars, at an interval of 4. A curve labeled M C intersects another two curves labeled A V C and A T C at 8 and 1 5 on the vertical axis. a. Suppose the market price of jump drives is $7. In the graph, outline an area that represents this rm's losses if it produces where MR 2 MC b. If the rm in (a) instead shuts down and produces 0 units, it will lose only its xed costs. Outline an area that represents this rm's costs. c. Which area is larger: its losses from producing where MR 2 M C, or its losses from producing 0 units of output? What should the rm do? d. Do your answers to (a), (b), and (c) change if the price of jump drives is $1 1 rather than $7

Step by Step Solution

There are 3 Steps involved in it

Step: 1

blur-text-image

Get Instant Access to Expert-Tailored Solutions

See step-by-step solutions with expert insights and AI powered tools for academic success

Step: 2

blur-text-image

Step: 3

blur-text-image

Ace Your Homework with AI

Get the answers you need in no time with our AI-driven, step-by-step assistance

Get Started

Recommended Textbook for

Intermediate Microeconomics and Its Application

Authors: walter nicholson, christopher snyder

11th edition

9781111784300, 324599102, 1111784302, 978-0324599107

More Books

Students also viewed these Economics questions