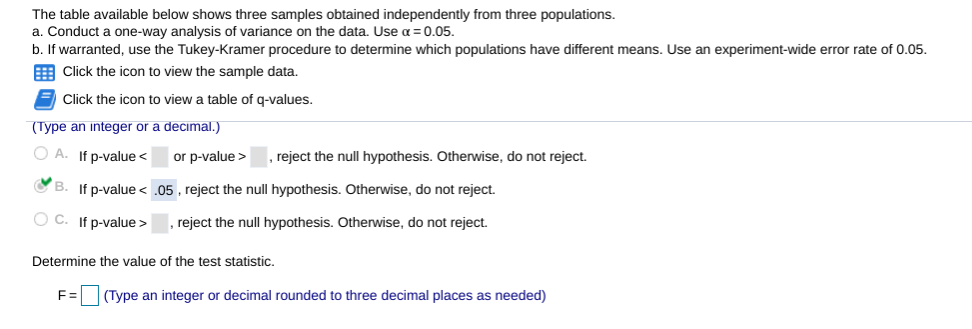
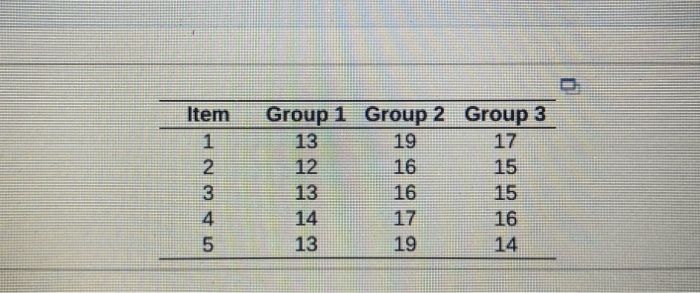
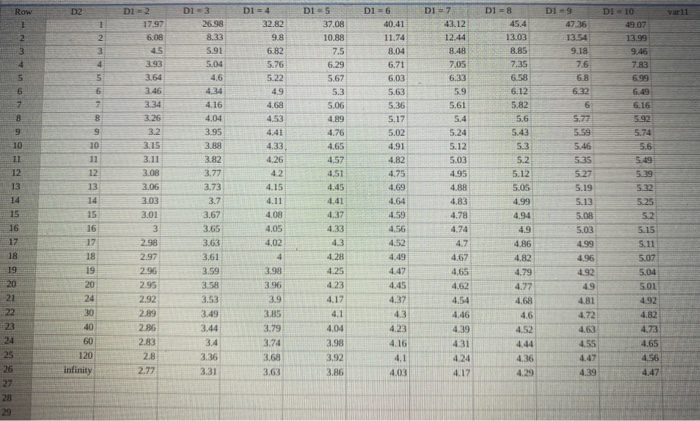
The table available below shows three samples obtained independently from three populations. a. Conduct a one-way analysis of variance on the data. Use a = 0.05. b. If warranted, use the Tukey-Kramer procedure to determine which populations have different means. Use an experiment-wide error rate of 0.05. Click the icon to view the sample data. Click the icon to view a table of q-values. (Type an integer or a decimal.) A. If p-value or p-value> reject the null hypothesis. Otherwise, do not reject. B. If p-value ,reject the null hypothesis. Otherwise, do not reject. Determine the value of the test statistic. F= (Type an integer or decimal rounded to three decimal places as needed) Item NH 2 3 4 5 Group 1 Group 2 Group 3 13 19 17 12 16 15 13 16 15 14 17 16 13 19 14 Row D2 D1 = 6 DI - 9 1 40.41 D1 = 4 32 82 9.8 6.82 DI = 3 26.98 8.33 5.91 5.04 DI = 7 43.12 12.44 8.48 2 2 13.54 11.74 8.04 DI - 10 49.07 13.99 9.46 7.83 3 9.18 5.76 6.71 7.05 76 4 5 4 5 6 6.32 6.49 6 7 5.22 4.9 4.68 4.53 DI -5 37.08 10.88 7.5 6.29 5.67 5.3 5.06 4.99 4.76 4.65 4.57 4.51 4,45 6.03 5.63 5.36 5.17 2 8 8 6.33 59 5.61 5.4 5.24 5.12 5.03 4.95 9 5.02 10 9 10 11 11 DI - 2 17.97 6.08 45 3.93 3.64 3.46 3.34 3.26 3.2 3.15 3.11 3.08 3.06 3.03 3.01 3 2.98 2.97 2.96 2.95 2.92 2.89 2.86 2.83 28 2.77 12 12 13 D1 = 8 45.4 13.03 8.85 7.35 6.58 6.12 5.82 5.6 5.43 5.3 5.2 5.12 5.05 4.99 4.94 4.9 4.86 4.82 4.79 4.77 4.68 4.6 4.34 4.16 4.04 3.95 3.89 3.82 3.77 3.73 3.7 3.67 3.65 3.63 3.61 3.59 3.58 3.53 6.16 592 5.74 5.6 5.49 5.29 5.32 5.25 52 6 5.77 5:59 5.46 5.35 5.27 5.19 5.13 5.08 5.03 4.99 4.88 4,83 4.91 4.82 4.75 4.69 4.64 4.59 4.56 4.52 4.49 4.47 14 15 16 17 4.37 4.78 4.74 14 15 16 17 18 19 20 21 5.15 4.33 4.26 42 4.15 4.11 4.08 4,05 4.02 4 3.98 3.96 3.9 3.85 3.79 3.74 3.68 3.63 4.3 4.28 18 5.11 5.07 5.04 4.92 5.01 19 20 24 30 40 423 4.17 4.45 4.37 4.7 4.67 4.65 4.62 4.54 4,46 4.39 431 4.9 4.81 4.72 4.23 60 4.16 4.92 4.82 4.73 4.65 4.56 4.47 4.44 4.55 3.44 3.4 3.36 3.31 23 24 25 26 27 28 29 4.04 3.98 3.92 3.86 120 4.1 4.03 4.17 4.29 4.39 The table available below shows three samples obtained independently from three populations. a. Conduct a one-way analysis of variance on the data. Use a = 0.05. b. If warranted, use the Tukey-Kramer procedure to determine which populations have different means. Use an experiment-wide error rate of 0.05. Click the icon to view the sample data. Click the icon to view a table of q-values. (Type an integer or a decimal.) A. If p-value or p-value> reject the null hypothesis. Otherwise, do not reject. B. If p-value ,reject the null hypothesis. Otherwise, do not reject. Determine the value of the test statistic. F= (Type an integer or decimal rounded to three decimal places as needed) Item NH 2 3 4 5 Group 1 Group 2 Group 3 13 19 17 12 16 15 13 16 15 14 17 16 13 19 14 Row D2 D1 = 6 DI - 9 1 40.41 D1 = 4 32 82 9.8 6.82 DI = 3 26.98 8.33 5.91 5.04 DI = 7 43.12 12.44 8.48 2 2 13.54 11.74 8.04 DI - 10 49.07 13.99 9.46 7.83 3 9.18 5.76 6.71 7.05 76 4 5 4 5 6 6.32 6.49 6 7 5.22 4.9 4.68 4.53 DI -5 37.08 10.88 7.5 6.29 5.67 5.3 5.06 4.99 4.76 4.65 4.57 4.51 4,45 6.03 5.63 5.36 5.17 2 8 8 6.33 59 5.61 5.4 5.24 5.12 5.03 4.95 9 5.02 10 9 10 11 11 DI - 2 17.97 6.08 45 3.93 3.64 3.46 3.34 3.26 3.2 3.15 3.11 3.08 3.06 3.03 3.01 3 2.98 2.97 2.96 2.95 2.92 2.89 2.86 2.83 28 2.77 12 12 13 D1 = 8 45.4 13.03 8.85 7.35 6.58 6.12 5.82 5.6 5.43 5.3 5.2 5.12 5.05 4.99 4.94 4.9 4.86 4.82 4.79 4.77 4.68 4.6 4.34 4.16 4.04 3.95 3.89 3.82 3.77 3.73 3.7 3.67 3.65 3.63 3.61 3.59 3.58 3.53 6.16 592 5.74 5.6 5.49 5.29 5.32 5.25 52 6 5.77 5:59 5.46 5.35 5.27 5.19 5.13 5.08 5.03 4.99 4.88 4,83 4.91 4.82 4.75 4.69 4.64 4.59 4.56 4.52 4.49 4.47 14 15 16 17 4.37 4.78 4.74 14 15 16 17 18 19 20 21 5.15 4.33 4.26 42 4.15 4.11 4.08 4,05 4.02 4 3.98 3.96 3.9 3.85 3.79 3.74 3.68 3.63 4.3 4.28 18 5.11 5.07 5.04 4.92 5.01 19 20 24 30 40 423 4.17 4.45 4.37 4.7 4.67 4.65 4.62 4.54 4,46 4.39 431 4.9 4.81 4.72 4.23 60 4.16 4.92 4.82 4.73 4.65 4.56 4.47 4.44 4.55 3.44 3.4 3.36 3.31 23 24 25 26 27 28 29 4.04 3.98 3.92 3.86 120 4.1 4.03 4.17 4.29 4.39